OPEN-SOURCE SCRIPT
Percentage Change Indicator

Percentage Change Indicator
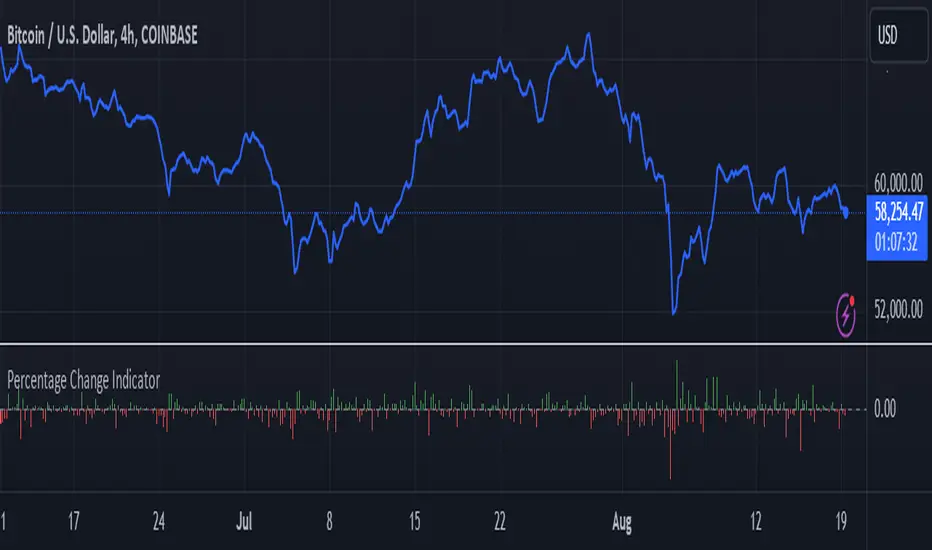
This indicator calculates and displays the percentage change between the current close price and the previous close price. It provides a clear visual representation of price movements, helping traders quickly identify significant changes in the market.
## Formula
The percentage change is calculated using the following formula:
```
Percentage Change = (Current Close - Previous Close) * 100 / Current Close
```
## Features
- Displays percentage change as a bar chart
- Green bars indicate positive changes
- Red bars indicate negative changes
- A horizontal line at 0% helps distinguish between positive and negative movements
## How to Use
1. Add the indicator to your chart
2. Observe the bar chart below your main price chart
3. Green bars above the 0% line indicate upward price movements
4. Red bars below the 0% line indicate downward price movements
5. The height of each bar represents the magnitude of the percentage change
This indicator can be particularly useful for:
- Identifying sudden price spikes or drops
- Analyzing the volatility of an asset
- Comparing price movements across different timeframes
- Spotting potential entry or exit points based on percentage changes
Customize the indicator's appearance in the settings to suit your charting preferences.
Note: This indicator works on all timeframes, adapting its calculations to the selected chart period.
Script de código abierto
Fiel al espíritu de TradingView, el creador de este script lo ha convertido en código abierto, para que los traders puedan revisar y verificar su funcionalidad. ¡Enhorabuena al autor! Aunque puede utilizarlo de forma gratuita, recuerde que la republicación del código está sujeta a nuestras Normas internas.
Exención de responsabilidad
La información y las publicaciones no constituyen, ni deben considerarse como asesoramiento o recomendaciones financieras, de inversión, de trading o de otro tipo proporcionadas o respaldadas por TradingView. Más información en Condiciones de uso.