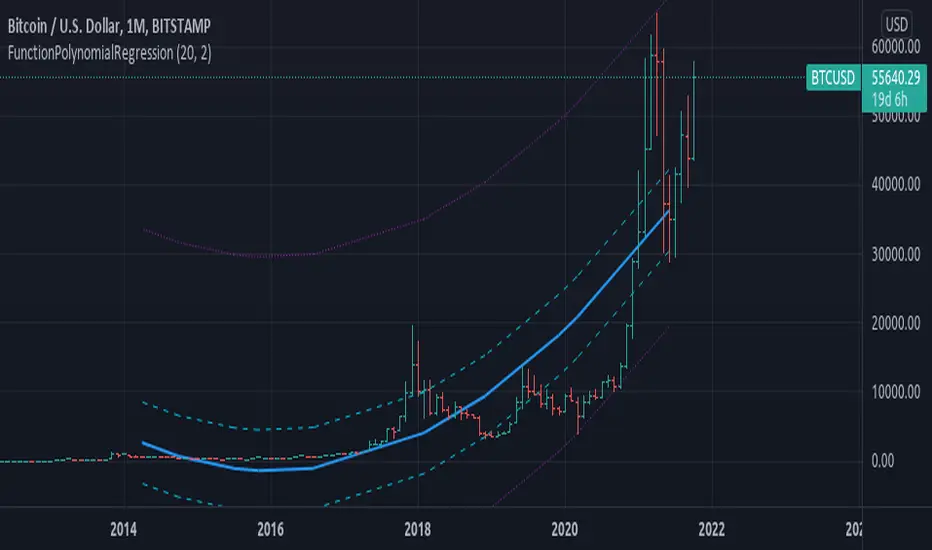
FunctionPolynomialRegression

TODO:
polyreg(sample_x, sample_y) Method to return a polynomial regression channel using (X,Y) sample points.
Parameters:
sample_x: float array, sample data X points.
sample_y: float array, sample data Y points.
Returns: tuple with:
_predictions: Array with adjusted Y values.
_max_dev: Max deviation from the mean.
_min_dev: Min deviation from the mean.
_stdev/_sizeX: Average deviation from the mean.
draw(sample_x, sample_y, extend, mid_color, mid_style, mid_width, std_color, std_style, std_width, max_color, max_style, max_width) Method for drawing the Polynomial Regression into chart.
Parameters:
sample_x: float array, sample point X value.
sample_y: float array, sample point Y value.
extend: string, default=extend.none, extend lines.
mid_color: color, default=color.blue, middle line color.
mid_style: string, default=line.style_solid, middle line style.
mid_width: int, default=2, middle line width.
std_color: color, default=color.aqua, standard deviation line color.
std_style: string, default=line.style_dashed, standard deviation line style.
std_width: int, default=1, standard deviation line width.
max_color: color, default=color.purple, max range line color.
max_style: string, default=line.style_dotted, max line style.
max_width: int, default=1, max line width.
Returns: line array.
Biblioteca Pine
Fiel al espíritu de TradingView, el autor ha publicado este código de Pine como biblioteca de código abierto, para que otros programadores Pine de nuestra comunidad puedan reutilizarlo. ¡Enhorabuena al autor! Puede usar esta biblioteca de forma privada o en otras publicaciones de código abierto, pero la reutilización de este código en publicaciones está sujeta a nuestras Normas internas.
Exención de responsabilidad
Biblioteca Pine
Fiel al espíritu de TradingView, el autor ha publicado este código de Pine como biblioteca de código abierto, para que otros programadores Pine de nuestra comunidad puedan reutilizarlo. ¡Enhorabuena al autor! Puede usar esta biblioteca de forma privada o en otras publicaciones de código abierto, pero la reutilización de este código en publicaciones está sujeta a nuestras Normas internas.