OPEN-SOURCE SCRIPT
Actualizado Future SD Projection
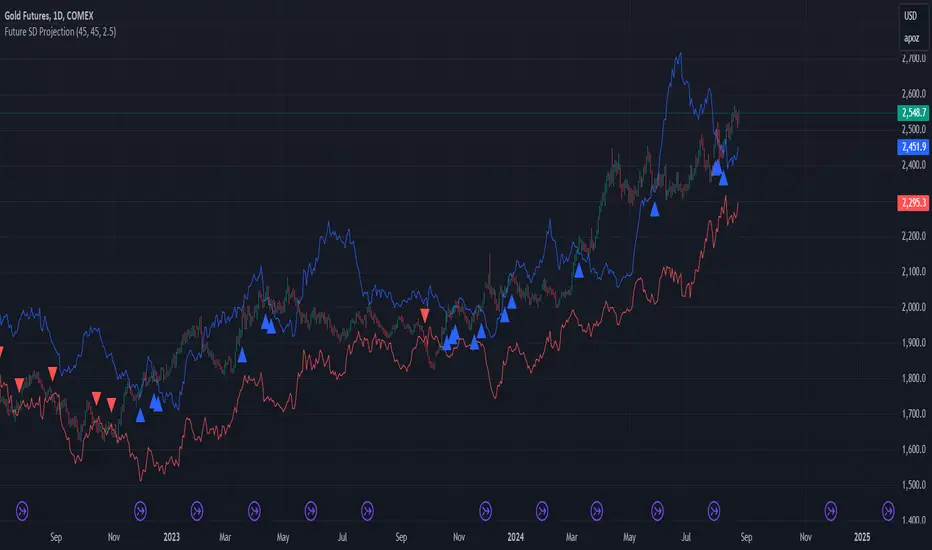
Future Standard Deviation Projector
This innovative indicator projects price volatility into the future, helping traders anticipate potential price ranges and breakouts. It calculates standard deviation bands based on recent price action and extends them forward, providing a unique perspective on future price movement possibilities.
Key Features:
- Projects standard deviation bands into the future
- Customizable lookback period for volatility calculation
- Adjustable future projection timeframe
- Flexible standard deviation multiplier
- Clear visual signals for band breaches
How it works:
1. Calculates standard deviation from recent closing prices
2. Projects upper and lower bands into the future
3. Plots these bands on the chart
4. Signals with arrows when closing price crosses projected bands
Use this indicator to:
- Gauge potential future price ranges
- Identify possible breakout levels
- Assess market volatility expectations
- Enhance your trading strategy with forward-looking volatility projections
Customize the settings to align with your trading timeframe and risk tolerance. Remember, while this tool offers valuable insights, it should be used in conjunction with other analysis methods for comprehensive trading decisions.
Note: Past performance and projections do not guarantee future results. Always manage your risk appropriately.
Notas de prensa
Future Standard Deviation ProjectorThis innovative indicator projects price volatility into the future, helping traders anticipate potential price ranges and breakouts. It calculates standard deviation bands based on recent price action and extends them forward, providing a unique perspective on future price movement possibilities.
Key Features:
- Projects standard deviation bands into the future
- Customizable lookback period for volatility calculation
- Adjustable future projection timeframe
- Flexible standard deviation multiplier
- Clear visual signals for band breaches
How it works:
1. Calculates standard deviation from recent closing prices
2. Projects upper and lower bands into the future
3. Plots these bands on the chart
4. Signals with arrows when closing price crosses projected bands
Use this indicator to:
- Gauge potential future price ranges
- Identify possible breakout levels
- Assess market volatility expectations
- Enhance your trading strategy with forward-looking volatility projections
Customize the settings to align with your trading timeframe and risk tolerance. Remember, while this tool offers valuable insights, it should be used in conjunction with other analysis methods for comprehensive trading decisions.
Note: Past performance and projections do not guarantee future results. Always manage your risk appropriately.
Script de código abierto
Fiel al espíritu de TradingView, el creador de este script lo ha convertido en código abierto, para que los traders puedan revisar y verificar su funcionalidad. ¡Enhorabuena al autor! Aunque puede utilizarlo de forma gratuita, recuerde que la republicación del código está sujeta a nuestras Normas internas.
Exención de responsabilidad
La información y las publicaciones no constituyen, ni deben considerarse como asesoramiento o recomendaciones financieras, de inversión, de trading o de otro tipo proporcionadas o respaldadas por TradingView. Más información en Condiciones de uso.