PROTECTED SOURCE SCRIPT
Actualizado TrendYFriend
Description
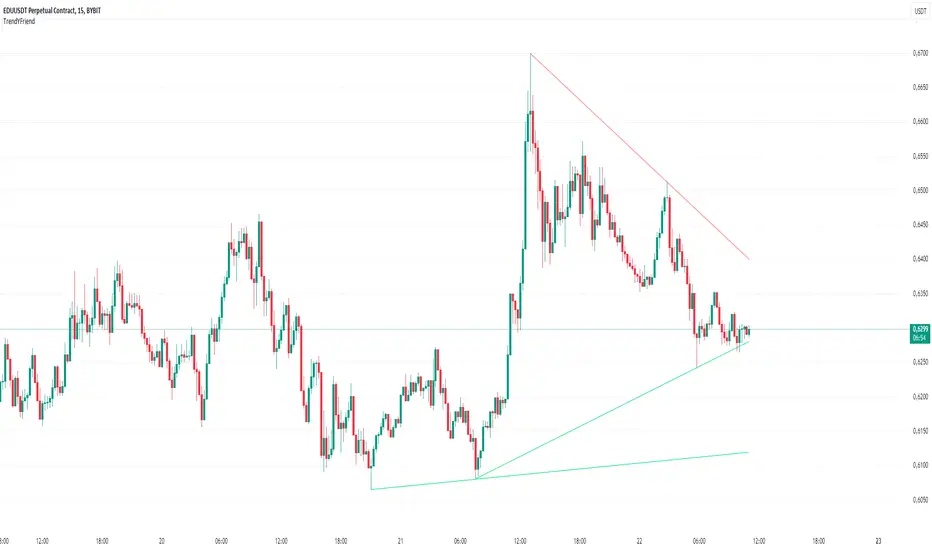
This script is designed for automatic trendline plotting and generating alerts for key market events: retests and trendline breakouts. Using trendlines is one of the core methods of technical analysis, helping traders to identify the current market trend and open positions in its direction. The script is based on detecting pivot points and connecting them with trendlines, which helps visualize important support and resistance levels.
Importance of Trading with the Trend
Trend trading is one of the most reliable and time-tested approaches in trading. The main principle is that a trend is more likely to continue than to reverse. Following the trend allows traders to enter positions when the probability of further movement in the direction of the trend is high. By trading with the trend, traders can capture prolonged market movements, reducing risk and increasing profit potential.
Opening Positions from Trendlines
Trendlines help identify key levels from which price may either bounce or break through. Upward trendlines serve as dynamic support levels, while downward lines act as resistance levels. It’s important to understand that trendline retests can provide a signal to enter trades in the direction of the primary trend. Conversely, a trendline breakout may signal a trend reversal or correction, which is also an important trading signal.
Main Features of the Script:
1. **Automatic Trendline Drawing** — connecting key pivot points and displaying upward and downward trends on the chart.
2. **Alerts for Retests and Breakouts** — generating signals when the price touches (retest) or breaks through a trendline.
- **Retest of Uptrend Line** — a signal of a potential bounce from support and continuation of the upward trend.
- **Retest of Downtrend Line** — a signal of a potential bounce from resistance in a downward trend.
- **Breakout of Uptrend Line** — a signal of a potential reversal or correction of the upward trend.
- **Breakout of Downtrend Line** — a signal of a potential reversal or continuation of the downward trend.
How to Use the Script:
1. Apply the script to the chart.
2. When an alert triggers, pay attention to the current market situation and verify if the signal aligns with your trading strategy.
3. Open positions in the direction of the trend during retests, or exit trades if a trendline breakout occurs.
Notas de prensa
DescriptionThis script is designed for automatic trendline plotting and generating alerts for key market events: retests and trendline breakouts. Using trendlines is one of the core methods of technical analysis, helping traders to identify the current market trend and open positions in its direction. The script is based on detecting pivot points and connecting them with trendlines, which helps visualize important support and resistance levels.
Importance of Trading with the Trend
Trend trading is one of the most reliable and time-tested approaches in trading. The main principle is that a trend is more likely to continue than to reverse. Following the trend allows traders to enter positions when the probability of further movement in the direction of the trend is high. By trading with the trend, traders can capture prolonged market movements, reducing risk and increasing profit potential.
Opening Positions from Trendlines
Trendlines help identify key levels from which price may either bounce or break through. Upward trendlines serve as dynamic support levels, while downward lines act as resistance levels. It’s important to understand that trendline retests can provide a signal to enter trades in the direction of the primary trend. Conversely, a trendline breakout may signal a trend reversal or correction, which is also an important trading signal.
Main Features of the Script:
1. **Automatic Trendline Drawing** — connecting key pivot points and displaying upward and downward trends on the chart.
2. **Alerts for Retests and Breakouts** — generating signals when the price touches (retest) or breaks through a trendline.
- **Retest of Uptrend Line** — a signal of a potential bounce from support and continuation of the upward trend.
- **Retest of Downtrend Line** — a signal of a potential bounce from resistance in a downward trend.
- **Breakout of Uptrend Line** — a signal of a potential reversal or correction of the upward trend.
- **Breakout of Downtrend Line** — a signal of a potential reversal or continuation of the downward trend.
How to Use the Script:
1. Apply the script to the chart.
2. When an alert triggers, pay attention to the current market situation and verify if the signal aligns with your trading strategy.
3. Open positions in the direction of the trend during retests, or exit trades if a trendline breakout occurs.
Script protegido
Este script se publica como código cerrado. Sin embargo, puede utilizarlo libremente y sin limitaciones: obtenga más información aquí.
Exención de responsabilidad
La información y las publicaciones que ofrecemos, no implican ni constituyen un asesoramiento financiero, ni de inversión, trading o cualquier otro tipo de consejo o recomendación emitida o respaldada por TradingView. Puede obtener información adicional en las Condiciones de uso.