PROTECTED SOURCE SCRIPT
Actualizado Snake

While moving averages are a good way to visualize price action, they are, in general, very poor indicators to trade against. Usually, the lowest prices occur before the cross over of multiple moving averages, while the best profits occur just before the crossunders of the moving averages.
This study captures the buy signals before the cross overs and sells just prior to the cross unders, when prices are lowest and highest respectively.
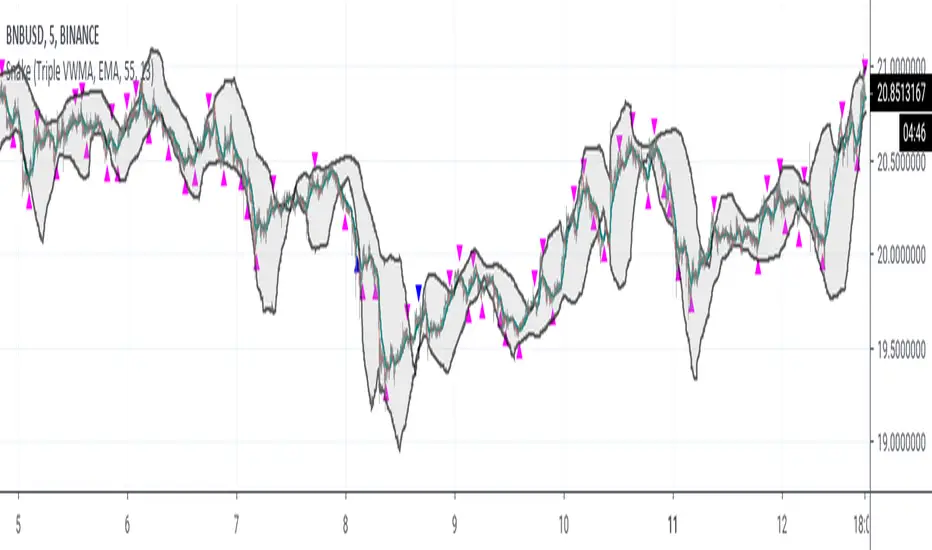
This is accomplished by treating the moving average as a "snake", specifically looking for the "head" of the snake to turn upwards when buying is most opportunistic. Note the the body must still be trending downward.
For selling, the "snake's head" must be turning down while the body is trending up.
This script uses blue arrows, pointing up, at the bottom, to indicate a buy signal, sending an alert of BUY ASSET.
Blue arrows, point down, at the top, represent sell signals with an alert of SELL ASSET.
The gray bar or strip is momentum. The snake's head must be above momentum for a sell, and below for a buy. This study does NOT work well with stable coins.
The longer the momentum, the more likely weak signals will be weeded out, but also presents less opportunities for buys.
The longer the length of the snake, the more likely cascading down turns will be ignored, but requires a longer trend to identify buy signals.
Notas de prensa
Changed arrows to triangles for better visability on zoomed out charts.Buys/sells NOT prequalified by momentum are shown are purple trangles.
Buys/sells prequalified by momentum are shown as blue triangles.
Notas de prensa
Added momentum filter to reduce weaker signalsNotas de prensa
Added ability to select the moving average type for the snake and the momentum. Currently supported type are: SMA, EMA, Double EMA.
Notas de prensa
Updated moving average types:SMA, Double SMA, Triple SMA
EMA, Double EMA, Triple EMA
WMA, Double WMA, Triple WMA
VWMA, Double VWMA, Triple VWMA
Hull, Double Hull, Triple Hull
Script protegido
Este script se publica como código cerrado. No obstante, puede utilizarlo libremente y sin ninguna limitación. Obtenga más información aquí.
Join my Patreon for exclusive access to Jackrabbit TV,
patreon.com/RD3277
patreon.com/RD3277
Exención de responsabilidad
La información y las publicaciones no constituyen, ni deben considerarse como asesoramiento o recomendaciones financieras, de inversión, de trading o de otro tipo proporcionadas o respaldadas por TradingView. Más información en Condiciones de uso.