OPEN-SOURCE SCRIPT
Volume Clouds
I know it isn't much, but it is my first time coding an indicator!
You might need to modify distance to fit the volatility and time frame of the chart you are looking at (if candles stay on top of cloud in an ugly mess, increase distance until signals can be seen). Sometimes heikin ashi candles can really help clear the picture up as well.
How to use:
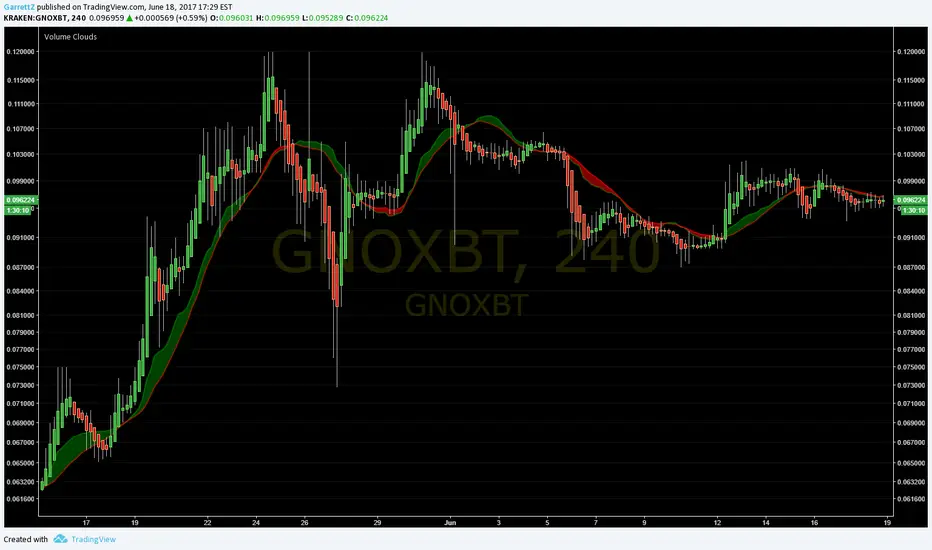
The lines are the Volume Weighted Moving Average (green) and Simple Moving Average (red).
Cloud is green when VWMA is above SMA ( bullish ) and red when SMA is above VWMA ( bearish ).
The thicker the cloud, the stronger the signal. Also, the farther price strays from the cloud, the more pressure there is for it to return.
Look for divergences:
When price passes below a green cloud you have a bullish divergence (or if cloud turns green at crossing point)
Price pass above red cloud = bearish divergence.
Or confirmations:
Price passes below red cloud = bearish confirmation.
Price pass above green cloud = bullish confirmation.
I hope this helps you at least a little! Twitter: GarrettZ
You might need to modify distance to fit the volatility and time frame of the chart you are looking at (if candles stay on top of cloud in an ugly mess, increase distance until signals can be seen). Sometimes heikin ashi candles can really help clear the picture up as well.
How to use:
The lines are the Volume Weighted Moving Average (green) and Simple Moving Average (red).
Cloud is green when VWMA is above SMA ( bullish ) and red when SMA is above VWMA ( bearish ).
The thicker the cloud, the stronger the signal. Also, the farther price strays from the cloud, the more pressure there is for it to return.
Look for divergences:
When price passes below a green cloud you have a bullish divergence (or if cloud turns green at crossing point)
Price pass above red cloud = bearish divergence.
Or confirmations:
Price passes below red cloud = bearish confirmation.
Price pass above green cloud = bullish confirmation.
I hope this helps you at least a little! Twitter: GarrettZ
Script de código abierto
Fiel al espíritu de TradingView, el creador de este script lo ha convertido en código abierto, para que los traders puedan revisar y verificar su funcionalidad. ¡Enhorabuena al autor! Aunque puede utilizarlo de forma gratuita, recuerde que la republicación del código está sujeta a nuestras Normas internas.
Exención de responsabilidad
La información y las publicaciones no constituyen, ni deben considerarse como asesoramiento o recomendaciones financieras, de inversión, de trading o de otro tipo proporcionadas o respaldadas por TradingView. Más información en Condiciones de uso.