OPEN-SOURCE SCRIPT
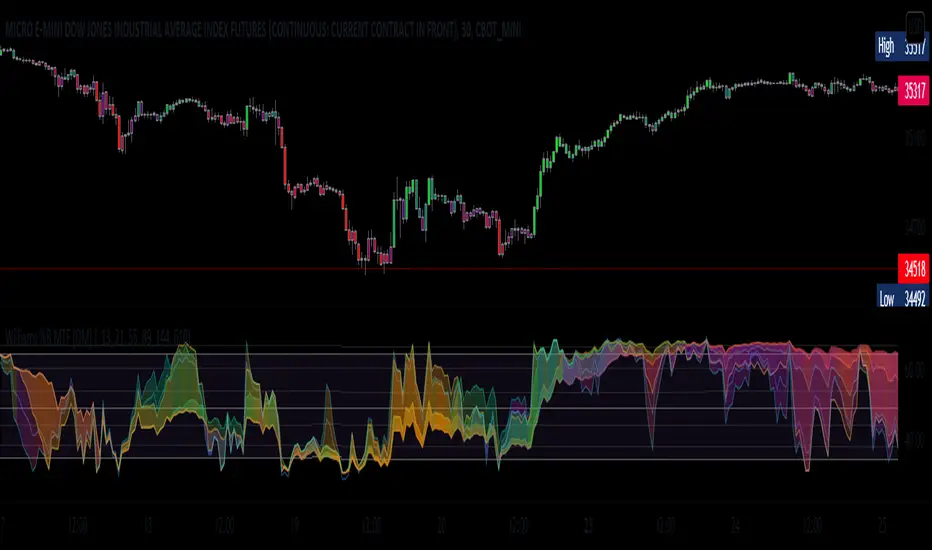
Actualizado William %R MTF [DM]
Greeting Colleagues
Today I share The Wlliams %R
Extras=
- 5 diferent length
- 1 extra signal with the technique used in the ultimate oscillator
- Fibo Leves based on ob os leves "width it's automatic"
- Colored bars bassed en average strength
- The indicator that is modified now has the same range as the ultimate oscillator.
Enjoy [;-)
//The Williams %R (%R) indicator was created by famed commodities trader and author Larry Williams.
//
//Calculation
//%R = (CurrentClose - Highest High) / (Highest High - Lowest Low) x -100
//
//Highest High = Highest High for the user defined look-back period.
//Lowest Low = Lowest Low for the user defined look-back period.
//
//The basics
//As previously mentioned, the %R is used to measure momentum. %R oscillates
//within a fixed range between the values of 0 and -100. Williams himself set the
//parameters of overbought as any reading between 0 and -20. His oversold
//parameters were readings between -80 and -100. It is important to note that these
//values are traditional examples. It may be beneficial for the technical analyst
//to set different parameters based on the specific instrument being analyzed. Wider
//or narrower overbought and oversold levels may be appropriate based on historical analysis.
//
//What to look for
//There are two major conditions identified by using the %R indicator.
//The first is standard overbought and oversold conditions. The second is momentum
//changes characterized by momentum failures.
//
//Overbought/Oversold
//Overbought and Oversold conditions are a very common signal generated by momentum oscillators.
//The %R indicator is no different.
Notas de prensa
Minor changesNotas de prensa
Added butterfly color rules to plotsAdded switch to hide parcels
Notas de prensa
Minor changesNotas de prensa
Added black background for use in the white chartsScript de código abierto
Fiel al espíritu de TradingView, el creador de este script lo ha convertido en código abierto, para que los traders puedan revisar y verificar su funcionalidad. ¡Enhorabuena al autor! Aunque puede utilizarlo de forma gratuita, recuerde que la republicación del código está sujeta a nuestras Normas internas.
Exención de responsabilidad
La información y las publicaciones no constituyen, ni deben considerarse como asesoramiento o recomendaciones financieras, de inversión, de trading o de otro tipo proporcionadas o respaldadas por TradingView. Más información en Condiciones de uso.
Script de código abierto
Fiel al espíritu de TradingView, el creador de este script lo ha convertido en código abierto, para que los traders puedan revisar y verificar su funcionalidad. ¡Enhorabuena al autor! Aunque puede utilizarlo de forma gratuita, recuerde que la republicación del código está sujeta a nuestras Normas internas.
Exención de responsabilidad
La información y las publicaciones no constituyen, ni deben considerarse como asesoramiento o recomendaciones financieras, de inversión, de trading o de otro tipo proporcionadas o respaldadas por TradingView. Más información en Condiciones de uso.