PROTECTED SOURCE SCRIPT
Shotoki - Relative V² Index
Actualizado
Hi,
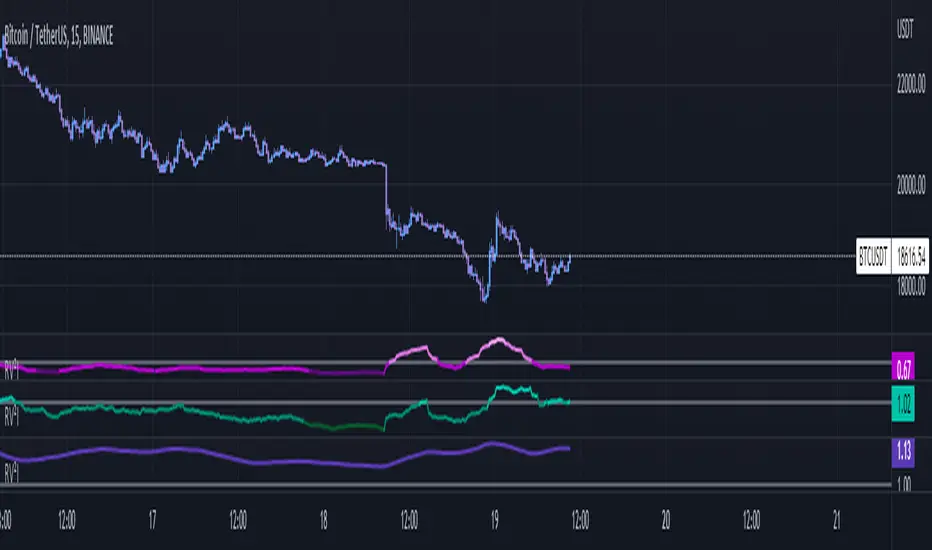
I share to you my Relative Volume/Volatility Index. They are 2 indicators in 1, but are calculated the same way. In purple we have the Relative Volume Index and in green the Relative Volatility Index
The RV²I is a ratio between a sum of the volume/volatility from a long period and the sum of the volume from a shorter period.
The shorter period has obviously less volume that's why we create a coefficient to make it relevant regarding the long and short period.
When the the RV²I is equal to 1 then the market is behaving as before.
We here more looking for rising up RV²I to anticipate big moves.
The lighter the Index is the more active the market is.
When the volume index is above the volatility one then the market is struggling to find trend.
When the volume index is below the volatility one then the market is more likely to have a trend, no struggle.
If you want to use only one of these I suggest you to use the purple one (volume). When it goes up then there are more volume in stake and that's where I'm looking for trades
You can use it at any timeframe.
Best regards, Shotoki
Notas de prensa
I added the Relative Capital Index in blueEverything is said in the title of the new index, it show if the movement of capital is increasing regarding the past or not
Notas de prensa
I updated the screenshotNotas de prensa
Change nameadded an alpha of the resistance volatility index
Notas de prensa
Remove the resistance part to make it an indicatorExención de responsabilidad
La información y las publicaciones que ofrecemos, no implican ni constituyen un asesoramiento financiero, ni de inversión, trading o cualquier otro tipo de consejo o recomendación emitida o respaldada por TradingView. Puede obtener información adicional en las Condiciones de uso.