S&P... where to now?

Back in March, I pointed out the imminent danger involved in a clear 5 wave Elliott pattern ending. I also said that we could have one more price high before heading down, but that the message would not change the longer term picture... that a major bear market was dead ahead.

Here we are, 9 months later and the market is dangerously close to being tipped over the edge.
A fellow analyst has posted a great synopsis of the fundamentals of the market currently. You can find it here:

Notice how quickly the market indicators, fundamental and technical have shifted from "how great this bull market is" to "how dangerously close to collapse we are". This is the nature of bear markets. They have the ability to wipe out years worth of gains in weeks.
Okay, lets get to the charts. So where does that leave us?
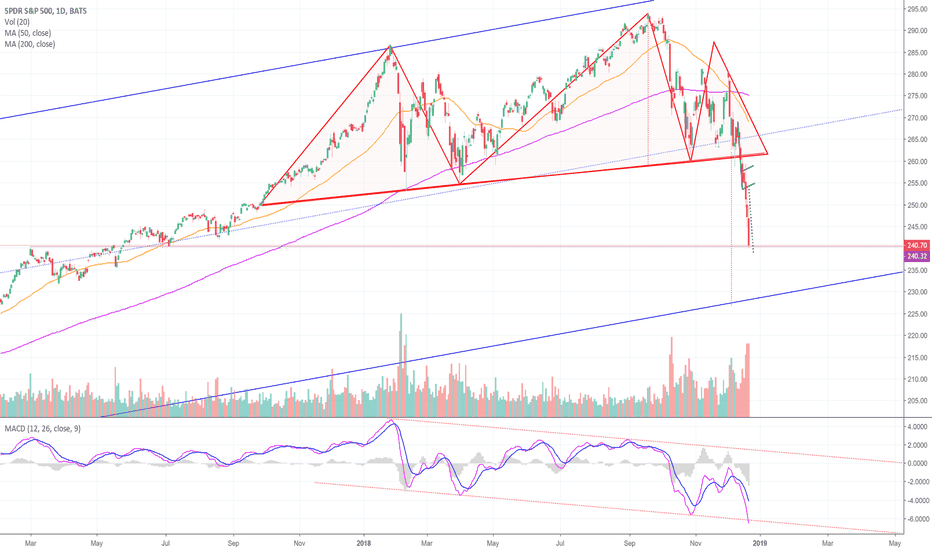
As you can see, I have not changed my charts at all since March except for the slight adjustment to take into account the nominal new high in price that happened after I posted.

The market has dropped very quickly back into the low 240's as of today. I fully expect it eventually to drop into target area #1, and then eventually into target area #2. Monthly MACD has had a bearish crossover with a ton of room too the downside.
Short term, we are oversold to a significant level, and nearing a crossroads of moving averages so it is possible we could get a dead cat bounce from near this area, however, we only have 3 waves down so far from the recent highs. I expect 2 more (waves 4 and 5) on the daily chart to block out the first intermediate wave 1 before we get a bounce of significance (wave 2).
The long term pattern I am projecting is really just a guess. Elliott wave corrective patterns on the multi-year timeframe are impossible to predict ahead of time... there are just too many possibilities. I am showing one of the most common patterns (zig zag). If it ends up being a zig zag, I expect the bear to be steep in an "A" wave, then correct up into a "B" wave that will end once most participants declare the bear market "over"... only to be followed by a devastating "C" wave that takes the markets down to capitulation.
The most important thing to take away is not the accuracy of the exact pattern in the future, its the message that the market sentiment has shifted dramatically, quickly. Rallies are opps to sell into, and risk aversion is now stylish once again.
Be safe out there. Do your own analysis. Don't risk more than you can afford to live without, and take care of your friends, families, and fellow traders. It's a rough one out there, and if the wheels start to fall off, there won't be many places to hide.

Here we are, 9 months later and the market is dangerously close to being tipped over the edge.
A fellow analyst has posted a great synopsis of the fundamentals of the market currently. You can find it here:

Notice how quickly the market indicators, fundamental and technical have shifted from "how great this bull market is" to "how dangerously close to collapse we are". This is the nature of bear markets. They have the ability to wipe out years worth of gains in weeks.
Okay, lets get to the charts. So where does that leave us?
As you can see, I have not changed my charts at all since March except for the slight adjustment to take into account the nominal new high in price that happened after I posted.

The market has dropped very quickly back into the low 240's as of today. I fully expect it eventually to drop into target area #1, and then eventually into target area #2. Monthly MACD has had a bearish crossover with a ton of room too the downside.
Short term, we are oversold to a significant level, and nearing a crossroads of moving averages so it is possible we could get a dead cat bounce from near this area, however, we only have 3 waves down so far from the recent highs. I expect 2 more (waves 4 and 5) on the daily chart to block out the first intermediate wave 1 before we get a bounce of significance (wave 2).
The long term pattern I am projecting is really just a guess. Elliott wave corrective patterns on the multi-year timeframe are impossible to predict ahead of time... there are just too many possibilities. I am showing one of the most common patterns (zig zag). If it ends up being a zig zag, I expect the bear to be steep in an "A" wave, then correct up into a "B" wave that will end once most participants declare the bear market "over"... only to be followed by a devastating "C" wave that takes the markets down to capitulation.
The most important thing to take away is not the accuracy of the exact pattern in the future, its the message that the market sentiment has shifted dramatically, quickly. Rallies are opps to sell into, and risk aversion is now stylish once again.
Be safe out there. Do your own analysis. Don't risk more than you can afford to live without, and take care of your friends, families, and fellow traders. It's a rough one out there, and if the wheels start to fall off, there won't be many places to hide.
Exención de responsabilidad
La información y las publicaciones que ofrecemos, no implican ni constituyen un asesoramiento financiero, ni de inversión, trading o cualquier otro tipo de consejo o recomendación emitida o respaldada por TradingView. Puede obtener información adicional en las Condiciones de uso.