Indicadores, estrategias y bibliotecas
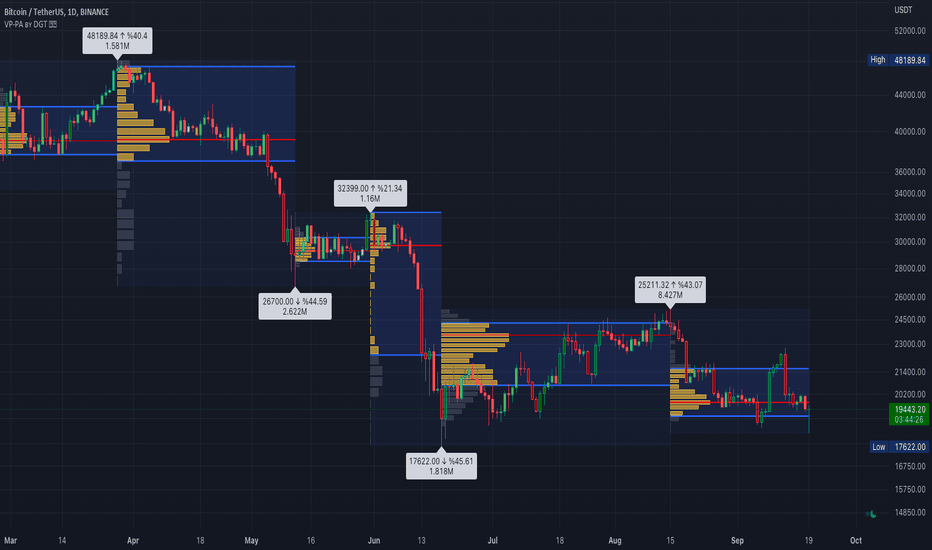
This indicator provides a high-resolution and high-precision implementation of Volume Profile with flexible range settings. Its key features include: 1. Support for a high resolution of up to 2,500 rows. 2. Capability to examine lower timeframe bars (default 5,000 intra-bars) for enhanced precision. 3. Three range modes — "Visible Range", "Anchored Range", and...
🧾 Description: This indicator calculates evolving value areas across 3 different timeframes/periods and combines them into one composite, multi-timeframe evolving value area - with each of the underlying timeframes' VAs assigned their own weighting/importance in the final calculation. Layered with extra smoothing options, this creates an informative and useful...
Volume Profile (also known as Price by Volume ) is an charting study that displays trading activity over a specified time period at specific price levels. It is plotted as a horizontal histogram on the finacial isntrumnet's chart that highlights the trader's interest at specific price levels. Specified time period with Pivots Anchored Volume Profile is...
Compare the relative valuation of up to 8 tickers. By taking a shorter term moving average and dividing by a longer term moving average(optionally with an offset) we get a value that is either above or below 1. Easy to tell what is undervalued and overvalued with this setup. Useful for comparing different asset classes or sector specific securities looking for...
Introduction Wikipedia: A Market Profile is an intra-day charting technique (price vertical, time/activity horizontal) devised by J. Peter Steidlmayer, a trader at the Chicago Board of Trade (CBOT), ca 1959-1985. Steidlmayer was seeking a way to determine and to evaluate market value as it developed in the day time frame. The concept was to display price on a...
Volume Profile (also known as Price by Volume) is an charting study that displays trading activity over a specified time period at specific price levels. It is plotted as a horizontal histogram on the finacial isntrumnet's chart that highlights the trader's interest at specific price levels. The histogram is used by traders to predict areas of support and...
This indicator is a Market Profiling tool used to analyse the Point of Control (POC) and Value Area (VAH/VAL) on the daily, weekly and monthly timeframes. It also optionally displays historical Value Areas to help find confluence with past data. The Value Area is a range of prices where the majority of trading volume took place on the prior trading day. In...
I have recently made a High Timeframe POC script (HFT POC) which is pretty popular. Thanks for this! There are many requests to include lower timeframes in this script, that is why I created this script. I could have incorporated all the timeframe POC's into one indicator but I went this route to keep things more organized between all the different timeframes....
Because the big Bitcoin crash I have been looking a lot at high timeframe metrics. I never spent much time learning POC so I decided to create a little script for determining these on higher timeframes. Currently included: Monthly, 3 months and 6 months. /* DEFINITION */ Point Of Control (= POC) is a price level at which the heaviest volumes were traded. Value...
The "POC and VAH VAL - All and Non-Broken" POC = Points of Control VAH = Value Area High VAL = Value Area Low This indicator aims to show you on the 5 minute time frame all POCs and VAHs/VALs and Non-Broken POCs and VAHs/VALs. (Non-Broken are POCS and VAHs/VALS where price action has not since crossed its path) In the screen image above I have used VPVR to back...
Sᴜᴘᴘᴏʀᴛ ᴀɴᴅ Rᴇꜱɪꜱᴛᴀɴᴄᴇ , is undoubtedly one of the key concepts of technical analysis █ Sᴜᴘᴘᴏʀᴛ ᴀɴᴅ Rᴇꜱɪꜱᴛᴀɴᴄᴇ Dᴇꜰɪɴɪᴛɪᴏɴ Support and Resistance terms are used by traders to refer to price levels on charts that tend to act as barriers, preventing the price of an financial instrument from getting pushed in a certain direction. A support level is a price...
This indicator shows POC (Point of Control) and VA (Value Area) High and Low as well as the developing ranges. This indicator makes use of the new arrays which means the resolution for calculating POC and VA is up to 100k bins at, in most cases, tick resolution and allows for custom time-frames. Not much else needs to be said about this indicator. Happy Trading Hancock
All in one pivot points of combined D, W, M CPR, Camarilla & Value area. Inspired by Pivotboss book.
Adapted existing Market Profile scripts to be move suitable for Futures Markets with Session and After Hours split Script Provides split Market Profiles for Session and After Hours Users can customize the Session and AH hours inputs to suit any ticker and their interpretation of prime and non-prime hours
Volume Profile Free Ultra SLI by RagingRocketBull 2019 Version 1.0 This indicator calculates Volume Profile for a given range and shows it as a histogram consisting of 100 horizontal bars. This is basically the MAX SLI version with +50 more Pinescript v4 line objects added as levels. It can also show Point of Control (POC), Developing POC, Value Area/VWAP StdDev...
Volume Profile Free MAX SLI by RagingRocketBull 2019 Version 1.0 All available Volume Profile Free MAX SLI versions are listed below (They are very similar and I don't want to publish them as separate indicators): ver 1.0: style columns implementation ver 2.0: style histogram implementation ver 3.0: style line implementation This indicator calculates Volume...
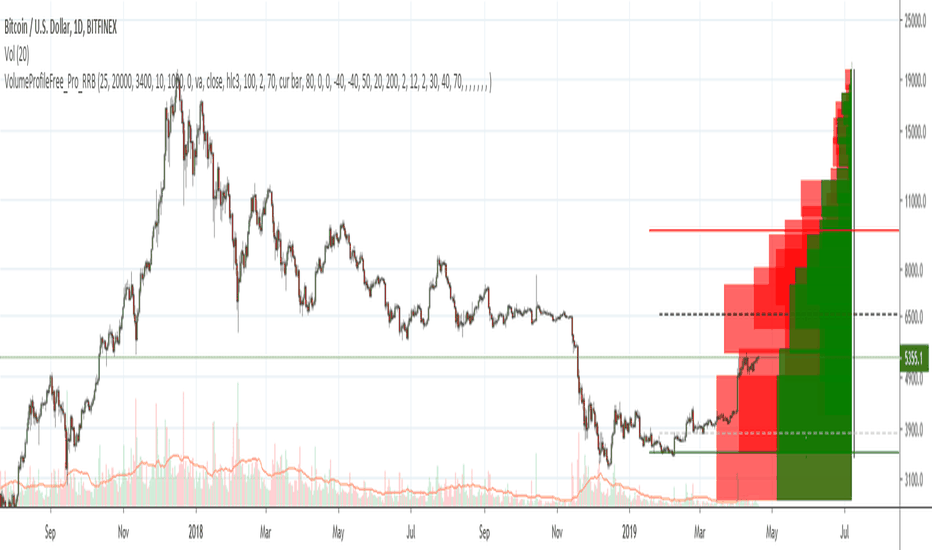
Volume Profile Free Pro by RagingRocketBull 2019 Version 1.0 All available Volume Profile Free Pro versions are listed below (They are very similar and I don't want to publish them as separate indicators): ver 1.0: style columns implementation ver 2.0: style histogram implementation ver 3.0: style line implementation This indicator calculates Volume Profile...


