Mean % Performance Overlay (5 tickers, Dividend Adjusted) This script overlays the dividend adjusted, equally weighted, mean % performance of the closing value of 5 tickers.Indicadorpor lewiky4
Clenow PlungerLooks for the ATR 3.0 that shakes most people out of momentum trades so that you can jump in for mean reversion back up.Indicadorpor brohammahasslehoff15
RSI Mean ReversionThis is classic Mean Reversion Strategy. I use this on commodities. This strategy trades mean reversion signals based on the Relative Strength Index (RSI). It is designed for volatile, mean-reverting instruments where price tends to snap back after reaching extreme levels. How it works: The strategy enters a long position when RSI crosses back above the oversold level, signalling that the selling pressure is fading and price is beginning to recover. It enters a short position when RSI crosseEstrategiapor kparicharak926152546
Golden PocketsIdentify high-probability bounce zones using the 0.618 Fibonacci retracement . When price touches a golden pocket level, it is expected to react and reverse, making these levels ideal for entries or exits. This indicator automatically detects swing highs and lows using a 5-bar pivot and plots a golden pocket each time a new structure forms: Bullish GP forms on a higher-high. The 0.618 of the swing low to high is plotted as a support level where price is expected to bounce upward. BearisIndicadorpor itsMisterPumpActualizado 113
TOTEM-TRADER - MM REVERSION 01HALF BACK NEVER LOOKED SO GOOD. The MM Reversion 01 is a proprietary momentum engine designed for the Measured Move (MM) System. By calculating hidden failures in price mean-reversion, it instantly highlights areas of undeniable directional pressure. Filter the chop, spot the real trend, and never guess about momentum again. Fully customizable for any asset or timeframe. by Totem TraderIndicadorpor imagmaxActualizado 4
Adaptive Linear Regression Structure [MarkitTick]💡 This indicator, is a sophisticated analytical tool designed to bridge the gap between classical statistical modeling and modern price action theory. By leveraging high-performance Ordinary Least Squares (OLS) calculations, it dynamically identifies the most statistically significant market structures—specifically linear regression channels—based on historical pivot points. Unlike static channels that rely on arbitrary lookback periods, this script scans a historical "horizon" of structural pivIndicadorpor MarkitTick360
Risk Calculation Mean ReversionOverview The Risk Indicator is a comprehensive position sizing and risk management tool designed for traders who want to visualize their potential profit/loss scenarios based on actual dollar amounts rather than just percentages. It displays multiple timeframe 200 EMAs while calculating real-time profit targets and stop-loss distances based on your specified buying power and risk parameters. Key Features 📊 Multi-Timeframe EMAs Current 200 EMA (red line) - The standard 200-period EMA on yoIndicadorpor confidencewindow7
Fractal Retracement [Jamallo](2025) Intro FRAMA is a moving average that adapts its speed based on fractal geometry — specifically, the fractal dimension (D) of recent price action. When price is trending strongly (low fractal dimension), it moves fast. When price is choppy/ranging (high fractal dimension), it slows down. This makes it far more responsive than a standard EMA or SMA. Breakdown: The indicator wraps this with a continuous range logic layer: the filtered line = k only moves if price breaks beyond the FRIndicadorpor Jamallo22164
J - 200sma Band Tracker(2022) A Bollinger Band-based overlay that tracks price equilibrium using a 200 SMA as its core. It layers multiple standard deviation bands (1–3σ) to highlight overbought/oversold zones, a narrow band to show tight consolidation, and an inner band to visualize micro price positioning.Indicadorpor Jamallo2212
Volatility-Adjusted Rate of Change [QuantAlgo]🟢 Overview The Volatility-Adjusted Rate of Change (VA-ROC) is a momentum oscillator that normalizes price changes against current market volatility, helping traders identify meaningful momentum shifts, spot overbought/oversold extremes, and filter out noise caused by changing volatility regimes. By measuring how large a price move is relative to what's normal for the instrument, this indicator reveals genuine directional pressure that raw momentum readings often obscure. 🟢 How It Works Indicadorpor QuantAlgo2382
Institutional Volume RSI [Adaptive]The Institutional Volume RSI is a next-generation momentum oscillator designed to solve the two biggest problems with standard RSI: Price Deception and Static Thresholds. Standard RSI uses fixed 70/30 levels to define "Overbought" and "Oversold." This is flawed because in a strong institutional trend, the market can stay "Overbought" for weeks. Selling just because RSI hit 70 is a guaranteed way to lose money. This tool fixes that. It replaces static lines with Adaptive Volatility BIndicadorpor abgthecoder1803
Mean Reversion [SIMI]This mean reversion indicator identifies extreme price deviations from the mean, providing high-probability reversal signals. Designed for confluence-based trading, it works best when combined with complementary indicators such as VWAP, price action, and volume analysis. 📊 Core Features Signal Types Prime Signals (Bright Green/Red Dots): Extreme reversions usually beyond ±1.5 SD - highest probability setups (you can customise this zone!) Regular Signals (Dark Green/Red Dots): Standard reversiIndicadorpor simipanda94
LuxyEnergyIndexThe Luxy Energy Index (LEI) library provides functions to measure price movement exhaustion by analyzing three dimensions: Extension (distance from fair value), Velocity (speed of movement), and Volume (confirmation level). LEI answers a different question than traditional momentum indicators: instead of "how far has price gone?" (like RSI), LEI asks "how tired is this move?" This library allows Pine Script developers to integrate LEI calculations into their own indicators and strategies. Bibliotecapor orenluxy420
Luxy VWAP Magic - MTF Projection EngineThis indicator transforms the classic VWAP into a comprehensive trading system. Instead of switching between multiple indicators, you get everything in one place: multi-timeframe analysis, statistical bands, momentum detection, volume profiling, session tracking, and divergence signals. What Makes This Different Traditional VWAP indicators show a single line. This tool treats VWAP as a foundation for complete market analysis. The indicator automatically detects your asset type (stocks, cryptoIndicadorpor orenluxy11762
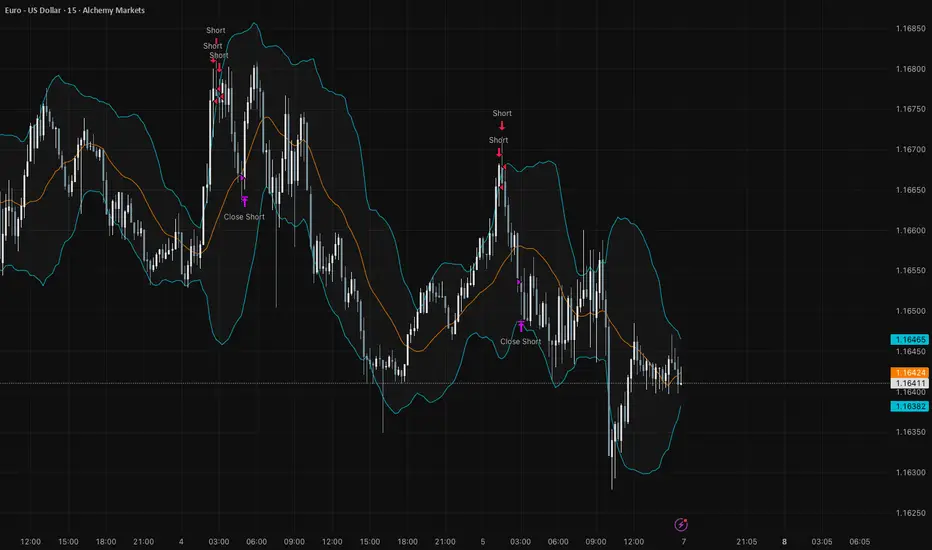
Bollinger Bands Mean Reversion using RSI [Krishna Peri]How it Works Long entries trigger when: - RSI reaches oversold levels, and - At least one bullish candle closes inside the lower Bollinger Band Short entries trigger when: - RSI reaches overbought levels, and - At least one bearish candle closes inside the upper Bollinger Band This approach aims to capture exhaustion moves where price pushes into extreme deviation from its mean and then snaps back toward the middle band. Important Disclaimer This is a mean-reversion strategy, which meansEstrategiapor thechadyogi8676
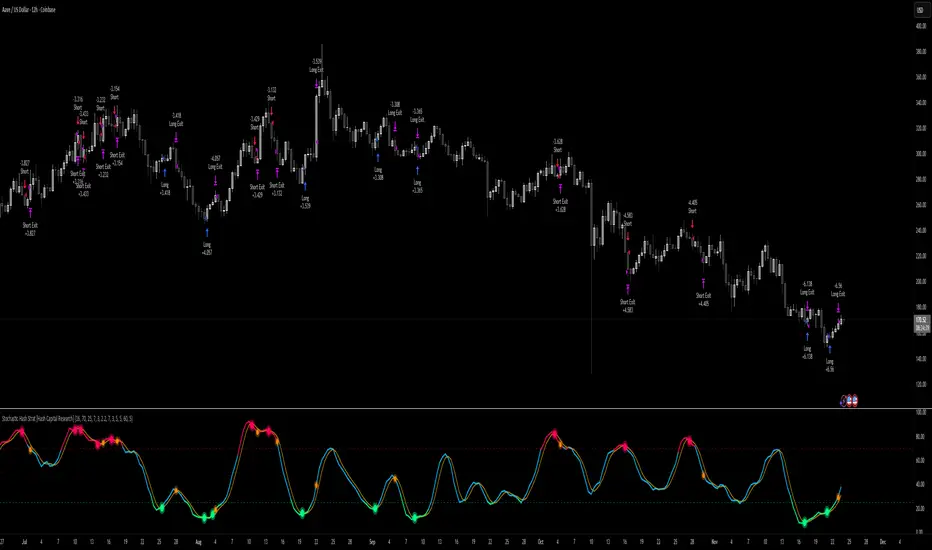
Stochastic Hash Strat [Hash Capital Research]# Stochastic Hash Strategy by Hash Capital Research ## 🎯 What Is This Strategy? The **Stochastic Slow Strategy** is a momentum-based trading system that identifies oversold and overbought market conditions to capture mean-reversion opportunities. Think of it as a "buy low, sell high" approach with smart mathematical filters that remove emotion from your trading decisions. Unlike fast-moving indicators that generate excessive noise, this strategy uses **smoothed stochastic oscillators** to iEstrategiapor Hash_Capital115
Order-Flow Proxy (VWAP Deviation Zones)Order-Flow Proxy (VWAP Deviation Zones) helps traders visualize when market price moves unusually far away from its Volume-Weighted Average Price (VWAP) — a key fair-value level used by institutional participants. When price stretches too far above or below VWAP, it often signals temporary imbalance between buying and selling pressure. This tool highlights those moments using simple color zones and an optional statistical Z-Score filter for deeper precision. In short: it’s a clean, miniIndicadorpor tkarolakActualizado 97
VWAP Entry Assistant (v1.0)Description: Anchored VWAP with a lightweight assistant for VWAP reversion trades. It shows the distance to VWAP, an estimated hit probability for the current bar, the expected number of bars to reach VWAP, and a recommended entry price. If the chance of touching VWAP is low, the script suggests an adjusted limit using a fraction of ATR. The VWAP line is white by default, and a compact summary table appears at the bottom-left. Educational tool. Not financial advice. Not affiliated with TradingIndicadorpor Seaman88Actualizado 55
Volume Delta [BigBeluga]🔵 OVERVIEW The Volume Delta indicator visualizes the dominance between buying and selling volume within a given period. It calculates the percentage of bullish (buy) versus bearish (sell) volume, then color-codes the candles and provides a real-time dashboard comparing delta values across multiple currency pairs. This makes it a powerful tool for monitoring order-flow strength and intermarket relationships in real time. 🔵 CONCEPTS Each bar’s buy volume is counted when the cloIndicadorpor BigBeluga8 3.4 K
Mean Reversion Probability Zones [BigBeluga]🔵 OVERVIEW The Mean Reversion Probability Zones indicator measures the likelihood of price reverting back toward its mean . By analyzing oscillator dynamics (RSI, MFI, or Stochastic), it calculates probability zones both above and below the oscillator. These zones are visualized as histograms, colored regions on the main chart, and a compact dashboard, helping traders spot when the market is statistically stretched and more likely to revert. 🔵 CONCEPTS Mean Reversion : The tendency Indicadorpor BigBeluga10 2.3 K
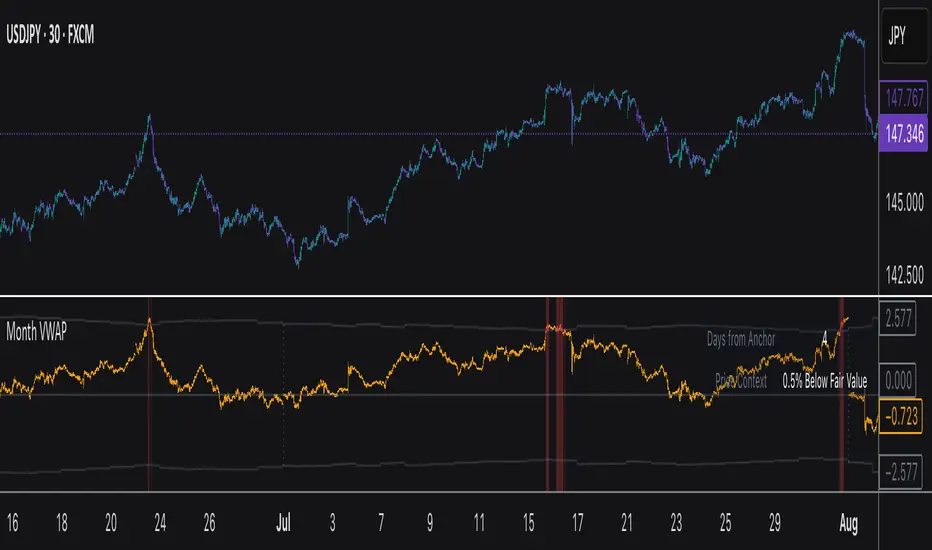
Monthly VWAPDescription This indicator identifies potential mean reversion opportunities by tracking price deviations from monthly VWAP with dynamic volatility-adjusted thresholds. Core Logic: The indicator monitors when price moves significantly away from monthly VWAP and looks for potential reversal opportunities. It uses ATR-based dynamic thresholds that adapt to current market volatility, combined with volume confirmation to filter out weak signals. Key Features: Adaptive Thresholds: ATR-based bIndicadorpor Mihkel00Actualizado 1165
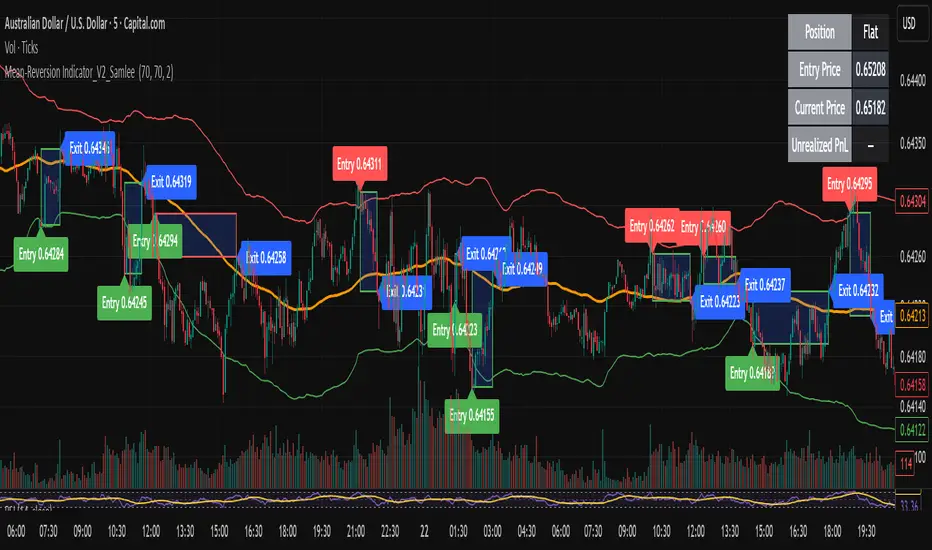
Mean-Reversion Indicator_V2_SamleeOverview This is the second version of my mean reversion indicator. It combines a moving average with adaptive standard deviation bands to detect when the price deviates significantly from its mean. The script provides automatic entry/exit signals, real-time PnL tracking, and shaded trade zones to make mean reversion trading more intuitive. Core Logic Mean benchmark: Simple Moving Average (MA). Volatility bands: Standard deviation of the spread (close − MA) defines upper and lower bands. Indicadorpor SamQuant2162
Mean Reversion & Momentum Hybrid | D_QUANT 📌 Mean Reversion & Momentum Hybrid | D_QUANT 📖 Description: This indicator combines mean reversion logic, volatility filtering, and percentile-based momentum to deliver clear, context-aware buy/sell signals designed for trend-following and contrarian setups. At its core, it merges: A Bollinger Band % Positioning Model (BB%) A 75th/25th Percentile Momentum System A Volatility-Adjusted Trend Filter using RMA + ATR All tied together with a dynamic gradient-style oscillator that visuIndicadorpor D_QUANT372
The Great Anchors: Dual AVWAP Powered by RSI The Great Anchors *Dual Anchored Volume Weighted Average Price Powered by RSI* --- 📌 Overview The Great Anchors is a dual AVWAP-based indicator that resets dynamically using RSI extremes — either from the current asset or a master symbol (e.g., BTCUSDT). It identifies meaningful shifts in price structure and momentum using these "anchored" levels. It’s designed to help traders spot trend continuations, momentum inflection points, and entry signals aligned with overbought/oversold conditiIndicadorpor CharmyDexter43