Ibex35, qué espera para hoy 25 de abril del 2024Ibex35, qué espera para hoy 25 de abril del 2024
Las principales bolsas europeas corrigieron tras el rebote de las últimas sesiones. La atención se centró en los resultados empresariales y el Ibex consiguió cerrar por encima del nivel de los 11.000 puntos tras caer un 0,43% y hoy partirá de los 11.
El poder de la comunidad

El oro se recupera por encima de los 2.300 dólares: ¿Qué sigue? El oro se recupera por encima de los 2.300 dólares: ¿Qué sigue?
El oro logró recuperar sus pérdidas ayer (la mayor caída diaria en casi 2 años) gracias a los débiles datos del PMI de EE.UU. La idea aquí es que los indicadores de crecimiento lento podrían empujar a la Reserva Federal hacia un recor

PRIMERA SEÑAL DE GIRO EN EL SP500 (Zona diaria)📊 Wall Street ha arrancado esta semana con ánimos renovados tras el fuerte correctivo, bajada, que sufrió la semana pasada. Donde el principal índice bursátil del mercado, experimentó un retroceso de -7% en los últimos 10 días. Hecho que no ocurría desde hace años en una semana de sesión de mercad

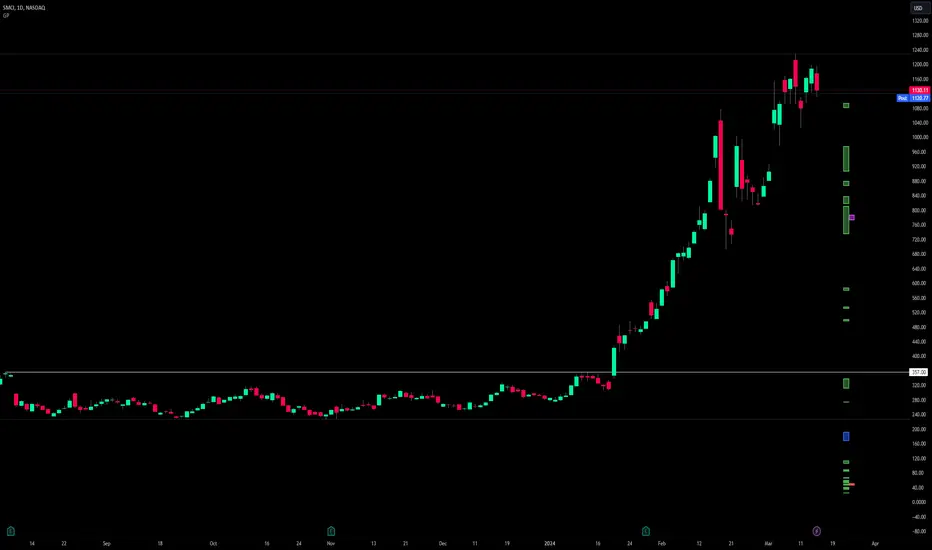
COMPRA CPNGCPNG
El Amazon coreano: El nuevo LÍDER
Hay pocas señales de FORTALEZA con mayor efectividad que mostrar FUERZA RELATIVA durante una corrección de mercado generalizada.
Por ese motivo, las empresas que LIDERAN durante las correcciones de mercado, tienden a ser las LÍDERES del próximo impulso.

IBEX35 Posible Vuelta AtrásLas bolsas de Europa han ampliado ganancias iniciales en su inicio de sesión y han recuperado entorno a un 1% con respecto al día anterior. El FTSE100 británico vuelve con la reválida de máximos históricos a la par que EURoStoxx 50 vuelve a impulsarse en dirección a los 5.000 puntos, siendo la empre

Cortos en IntelBuenas tardes traders,
Acabamos la semana con un corto en Intel.
La compañia presenta un deterioro interesante de sus fundamentales, que en 1 aproximadamente 1 año ha triplicado su ratio de endeudamiento, y su PER se encuentra en niveles muy altos (+100) .
Desde el punto de vista técnico, ha cerr

Ibex35, qué esperar para hoy 19 de abril del 2024Ibex35, qué esperar para hoy 19 de abril del 2024
La renta variable gira a la baja con las tensiones en Oriente Medio. Durante la madrugada se han producido ataques por parte de Israel sobre Irán. Los analistas tratan de concretar la magnitud y el alcance de esos ataques.
En la sesión de ayer el I

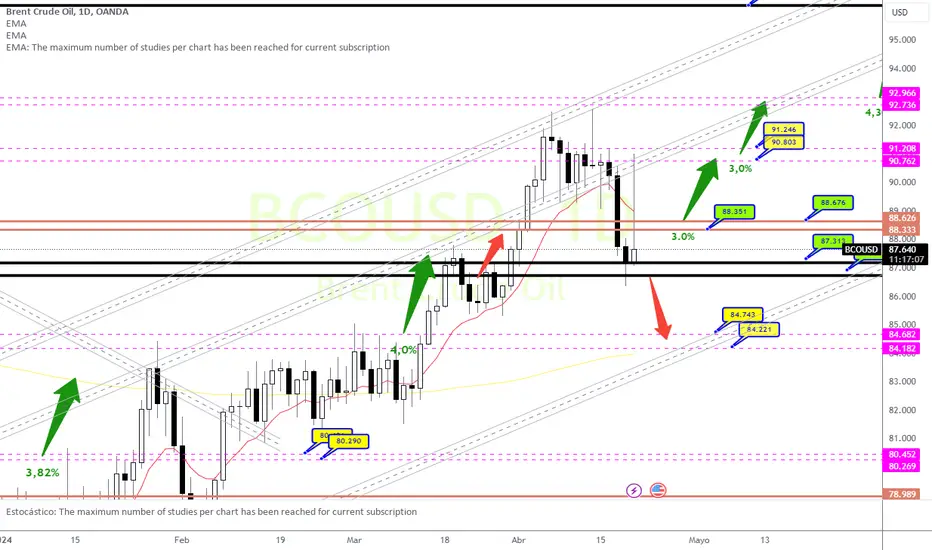
Petróleo: ¿Qué puede suceder? Niveles claves
Desde mayo del 2022, el crudo Brent ha experimentado una marcada tendencia a la baja, deslizándose desde su posición en torno a los 125 dólares hasta alcanzar los 72 dólares. Este declive ha sido significativo, ya que ha coincidido con una línea de tendencia bajista de largo plazo, agregando pres
🌱 Cacao: Verde en Gráfico, ¡Oro en Bolsillo!Buenos días Traders,
Hoy os traigo un análisis que está literalmente que se sale de la gráfica, tanto en sabor, como en cifras.
Nos zambullimos en el apasionante mercado del cacao, ese grano que no solo nos hace la boca agua sino que también está haciendo las delicias de los bolsillos de los inve

Análisis Semanal USD/JPY - ¿Se acaba la tendencia alcista?Hola, traders! ¡Feliz semana!
¿Listos para elevar vuestro trading? No os perdáis mi último análisis del USD/JPY. En este video, desgloso los aspectos técnicos y fundamentales para que podáis maximizar vuestras ganancias.
¿Dudas? ¿Preguntas? ¡Estoy aquí para ayudar! Dejad un comentario y os ayudare

Ver todas las ideas seleccionados por los editores
USDJPY sensible a los swaps de divisas en el eurodollar
El sistema monetario basado en el eurodólar es una compleja red de interconexiones financieras que opera a través de la creación autoreferencial de dinero crédito. Es la piedra angular de todo el sistema monetario global. La generación de dólares offshore se lleva a cabo mediante préstamos en dóla


Ver todas las ideas seleccionados por los editores
Análisis Semanal USD/JPY - ¿Se acaba la tendencia alcista?Hola, traders! ¡Feliz semana!
¿Listos para elevar vuestro trading? No os perdáis mi último análisis del USD/JPY. En este video, desgloso los aspectos técnicos y fundamentales para que podáis maximizar vuestras ganancias.
¿Dudas? ¿Preguntas? ¡Estoy aquí para ayudar! Dejad un comentario y os ayudare


Ver todas las ideas seleccionados por los editores
Percent Rank HistogramThis Pine script indicator is designed to create a visual representation of the percent rank for multiple financial instruments. Here's a breakdown of its key features:
Percent Rank Calculation:
The core functionality of this Pine script indicator revolves around the calculation of the percent r

Heat Map SeasonsHeat Map Seasons indicator
Indicator offers traders a unique perspective on market dynamics by visualizing seasonal trends and deviations from typical price behavior. By blending regression analysis with a color-coded heat map, this indicator highlights periods of heightened volatility and helps

Index Generator [By MUQWISHI]▋ INTRODUCTION :
The “Index Generator” simplifies the process of building a custom market index, allowing investors to enter a list of preferred holdings from global securities. It aims to serve as an approach for tracking performance, conducting research, and analyzing specific aspects of the glob

Higher-timeframe requests█ OVERVIEW
This publication focuses on enhancing awareness of the best practices for accessing higher-timeframe (HTF) data via the request.security() function. Some "traditional" approaches, such as what we explored in our previous `security()` revisited publication, have shown limitations

Trailing Management (Zeiierman)█ Overview
The Trailing Management (Zeiierman) indicator is designed for traders who seek an automated and dynamic approach to managing trailing stops. It helps traders make systematic decisions regarding when to enter and exit trades based on the calculated risk-reward ratio. By providing a cle

Periodic Activity Tracker [LuxAlgo]The Periodic Activity Tracker tool periodically tracks the cumulative buy and sell volume in a user-defined period and draws the corresponding matching bars and volume delta for each period.
Users can select a predefined aggregation period from the following options: Hourly, Daily, Weekly, and Mo

Gaps Profile [vnhilton]Note: If you get an error preventing indicator from executing due to a loop running longer than >500ms, please lower the amount of boxes shown and/or increase the minimum gap % threshold.
OVERVIEW
The Gaps Profile (GP) simply shows the remaining gaps on the chart that have yet to be closed. Gaps
TTrades Daily Bias [TFO]Inspired by @TTrades_edu video on daily bias, this indicator aims to develop a higher timeframe bias and collect data on its success rate. While a handful of concepts were introduced in said video, this indicator focuses on one specific method that utilizes previous highs and lows. The following des

Risk Management Chart█ OVERVIEW
Risk Management Chart allows you to calculate and visualize equity and risk depend on your risk-reward statistics which you can set at the settings.
This script generates random trades and variants of each trade based on your settings of win/loss percent and shows it on the chart as dif

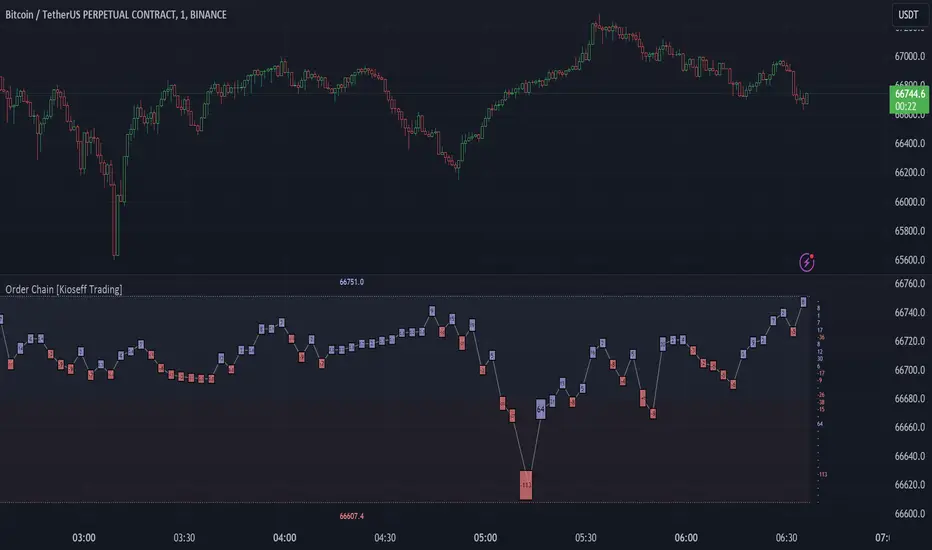
Order Chain [Kioseff Trading]Hello!
This indicator "Order Chain" uses live tick data (varip) to retrieve live tick volume.
This indicator must be used on a live market with volume data
Features
Live Tick Volume
Live Tick Volume Delta
Orders are appended to boxes, whose width and height are scaled proportional to th
Ver todas los scripts seleccionados por los editores