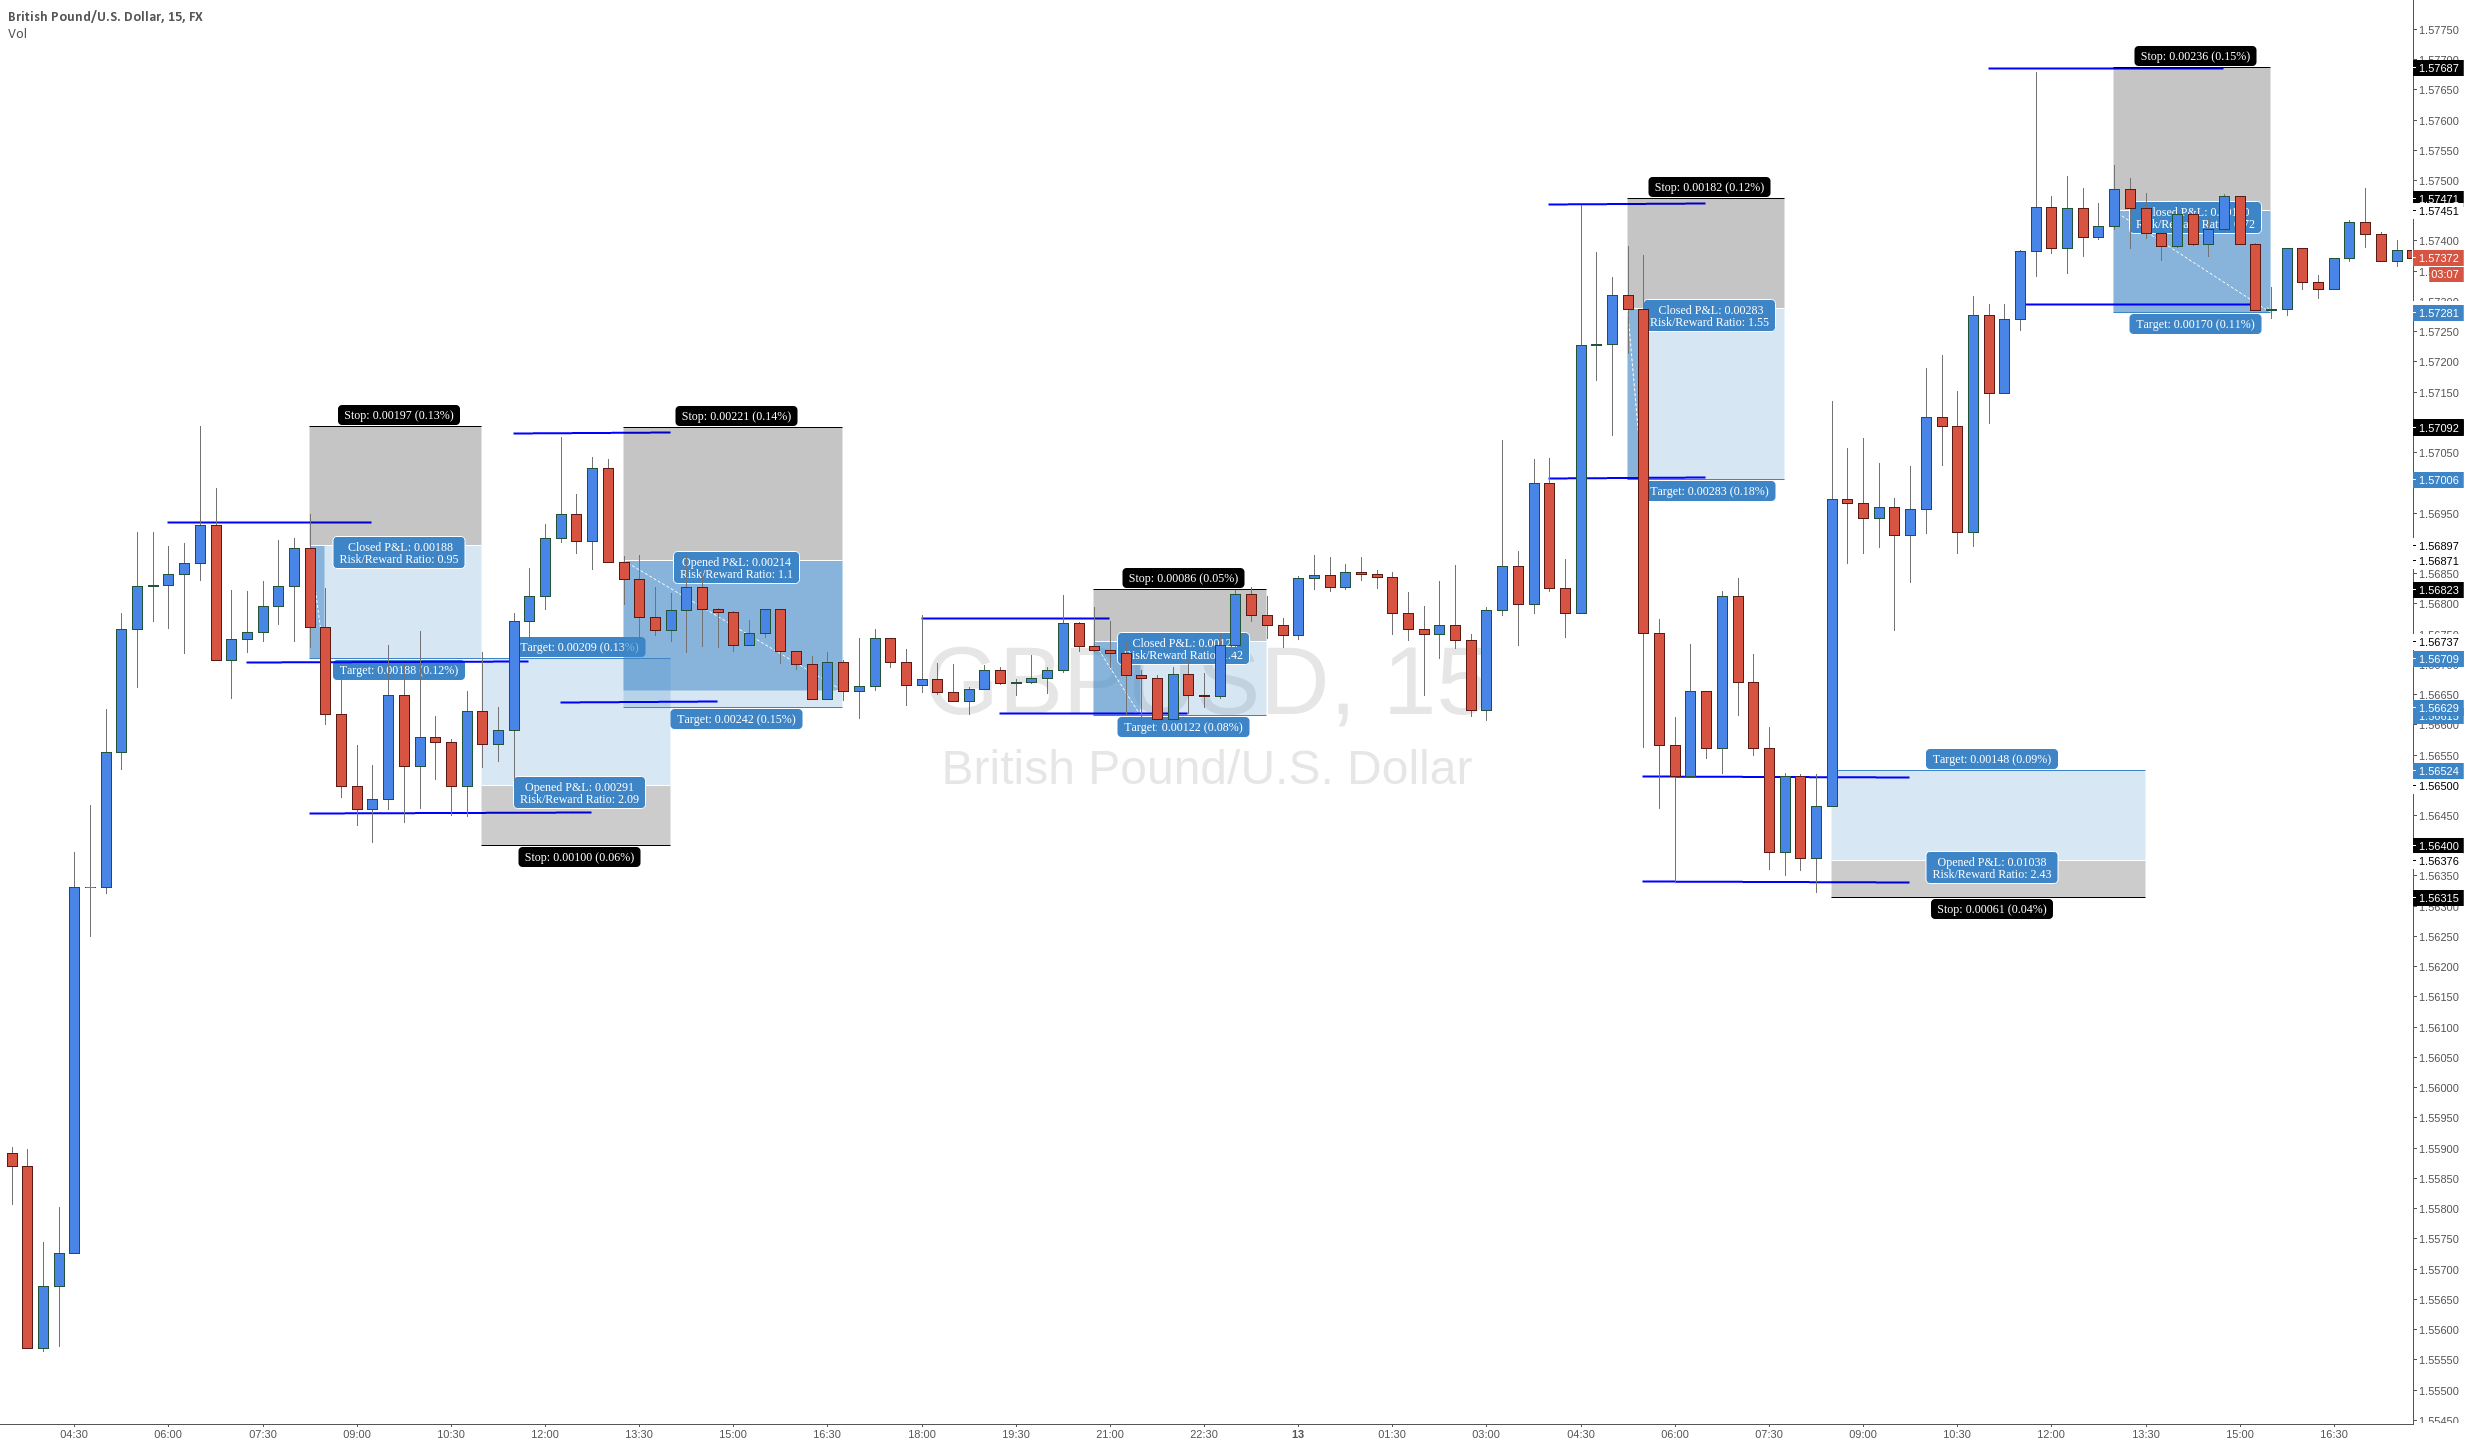
this indicator is for use with the Rejection Spike Strategy I recently publish
Have't had chance to test it yet so feel free to try.
Details of the strategy are listed in the link below
Have't had chance to test it yet so feel free to try.
Details of the strategy are listed in the link below
study(title="VDUB_RejectionSpike_v1", shorttitle="VDUB_RejectionSpike_v1", overlay=true)
//==============================inside channel===============================================//
len = input(20, minval=1, title="Length")
src = input(close, title="Source")
out = ema(src, len)
plot(out, title="EMA", color=red)
last8h = highest(close,13)
lastl8 = lowest(close, 13)

plot(last8h, color=black,style=line, linewidth=3)
plot(lastl8, color=black,style=line, linewidth=3)

bearish = cross(close,out) == 1 and close[1] > close
bullish = cross(close,out) == 1 and close[1] < close

plotshape(bearish, color=red, style=shape.triangledown, text="", location=location.abovebar)
plotshape(bullish, color=green, style=shape.triangleup, text="", location=location.belowbar)
//-------------LB Range---------------------------
channel=input(false, title="channel")
up = close<nz(up[1]) and close>down[1] ? nz(up[1]) : high
down = close<nz(up[1]) and close>down[1] ? nz(down[1]) : low
ul=plot(channel?up:up==nz(up[1])?up:na, color=navy, linewidth=4, style=linebr, title="Up")
ll=plot(channel?down:down==nz(down[1])?down:na, color=navy, linewidth=4, style=linebr, title="Down")
//==============================Outside channel===============================================//
length1 = input(13, minval=1, title="Upper Channel")
length2 = input(13, minval=1, title="Lower Channel")

upper = highest(length1)
lower = lowest(length2)

basis = avg(upper, lower)

l = plot(lower, style=circles, linewidth=2, color=lime)
u = plot(upper, style=circles, linewidth=2, color=lime)

fill(u, l, color=white, transp=75, title="Fill")
//============================zigzag======//
length = input(5)
showBasis = input(false)
hls = ema(hl2, length)

plot(not showBasis ? na : hls, color=black)
isRising = hls >= hls[1]

zigzag = isRising and not isRising[1] ? lowest(length) :  not isRising and isRising[1] ? highest(length) : na
plot(zigzag, color=black)
//============================Ichomku cloud
show_cloud = input(true, title="Display Ichimoku Cloud:")
conversionPeriods = input(34, minval=1)
basePeriods = input(26, minval=1)
laggingSpan2Periods = input(52, minval=1)
displacement = input(26, minval=1)

donchian(len) => avg(lowest(len), highest(len))

conversionLine = donchian(conversionPeriods)
baseLine = donchian(basePeriods)
leadLine1 = avg(conversionLine, baseLine)
leadLine2 = donchian(laggingSpan2Periods)

plot(not show_cloud ? na : conversionLine, color=blue,linewidth=3, style=line, title="Mid line resistance levels")
//plot(baseLine, color=red, title="Base Line")
//plot(close, offset = -displacement, color=green, title="Lagging Span")

p1 = plot(not show_cloud ? na : leadLine1, offset = displacement, color=green, title="Lead 1")
p2 = plot(not show_cloud ? na : leadLine2, offset = displacement, color=red, title="Lead 2")
fill(p1, p2)
//-------------------------------------------------------------
