
XAUUSD — 4,055 Has to Hold
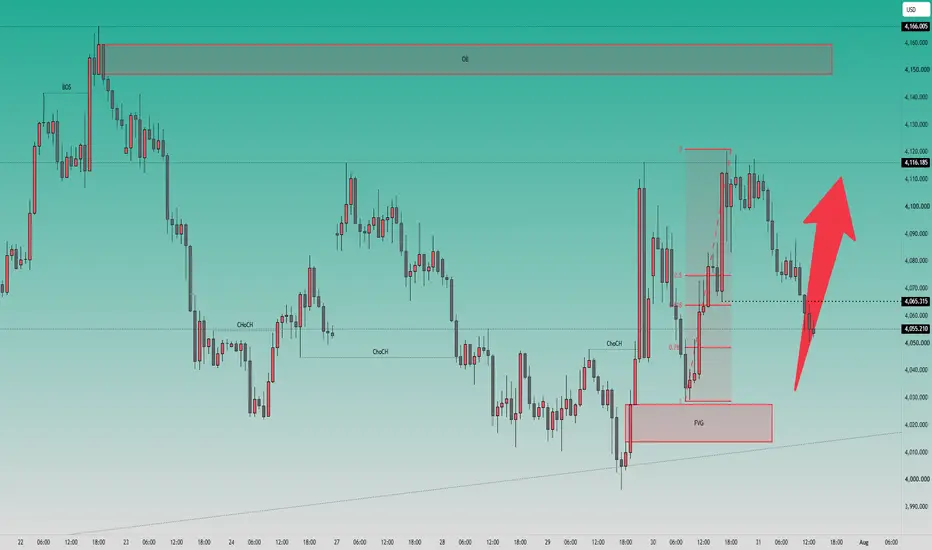
Gold got hit with fresh selling pressure, but the reaction around 4,055 is the part of the chart I keep coming back to.
Price pushed lower after failing to extend cleanly above the 4,100 area, and that fits the wider story: USD is trying to recover, geopolitical tension is keeping inflation risk alive, and the technical backdrop still has sellers watching closely. But when I slow the chart down, gold is not simply collapsing. It is pulling back into the same area where buyers previously stepped in, right above the FVG zone.
For newer traders, this is where the chart becomes more useful than the noise. A strong drop into a retracement zone can feel bearish, but if price holds around the 0.5 - 0.618 area and starts reacting, it can mean the market is only breathing back into discount before another recovery attempt.
That is why my main view is short-term bullish while gold holds above 4,055.210 and 4,065.315. If buyers defend this zone, the next area price may try to revisit is 4,116.185. A clean break above that would open the door toward the larger order block around 4,145 - 4,160, where the real test will come.
This bullish idea becomes weak if gold loses 4,055.210 and fails to recover. A deeper break below the FVG area around 4,015 - 4,030 would tell me buyers lost the base, and sellers may try to pull price back toward 4,000.
Key price zones to watch
Current reaction area: 4,055.210 - 4,065.315
Main demand / FVG zone: 4,015 - 4,030
Bullish confirmation zone: clean reclaim above 4,065.315
First upside target: 4,116.185
Main upside order block target: 4,145 - 4,160
Major upside liquidity: 4,166.005
Lower support if buyers fail: 4,000
Invalidation: clean close below 4,015
Do you see this 4,055 reaction as buyers defending the pullback, or would you wait for 4,116 to break before trusting the recovery?

👉 5–7 Free One-Shot Signals Weekly
👉 Daily Market Plan & Bias
🔥 VIP: 4–6 Swings + 10–20 Scalps Daily
📈 Transparent results, clear setups
👉Click here: t.me/+FgX34kKeY0cyZjc1
👉 Daily Market Plan & Bias
🔥 VIP: 4–6 Swings + 10–20 Scalps Daily
📈 Transparent results, clear setups
👉Click here: t.me/+FgX34kKeY0cyZjc1
Publicaciones relacionadas
Exención de responsabilidad
La información y las publicaciones no constituyen, ni deben considerarse como, asesoramiento o recomendaciones financieras, de inversión, de trading u otro tipo, proporcionadas o respaldadas por TradingView. Obtenga más información en Condiciones de uso.