🔎 Current Situation
Timeframe: Daily (1D)
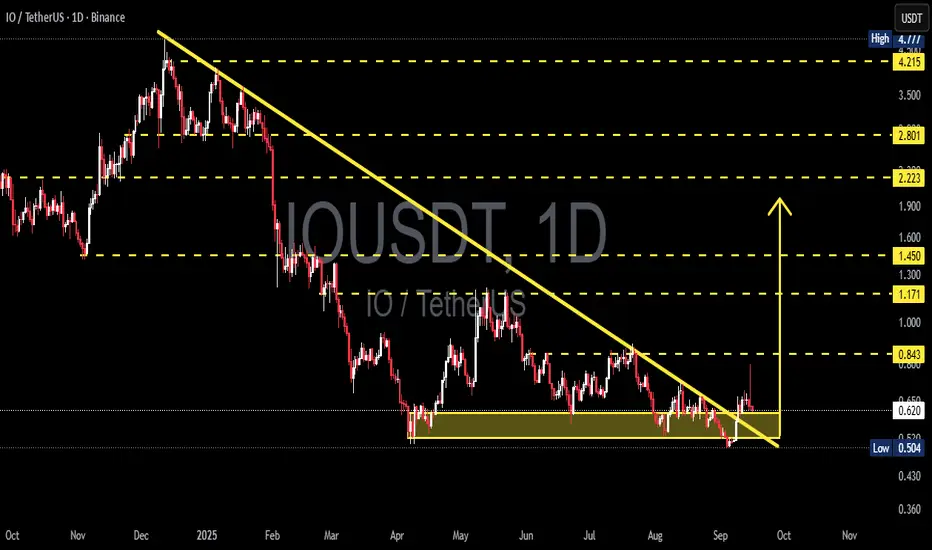
Main Trend: Prolonged downtrend since late 2024 (yellow trendline).
Key Zone: Price is consolidating inside the 0.50 – 0.62 accumulation box, which has acted as strong demand multiple times.
Breakout Attempt: Price briefly broke above the trendline and spiked to 0.84, but quickly rejected → potential bull trap.
---
🧩 Pattern Observations
1. Accumulation Zone (Yellow Box)
Multiple retests confirm this as a critical demand area.
Buyers and sellers are locked in a strong battle here.
2. Descending Triangle / Falling Wedge
Structure resembles a descending triangle (bearish bias if breakdown below 0.50).
Alternatively, it can be read as a falling wedge (bullish if breakout is confirmed).
3. False Breakout (Bull Trap?)
The spike to 0.84 followed by rejection hints at a possible liquidity grab.
Confirmation is needed to validate whether this is a reversal signal or just a trap.
---
🚀 Bullish Scenario
Confirmation Needed:
A daily close above 0.843 with strong volume.
Retest of the downtrend line as new support.
Bullish Targets:
TP1: 1.171
TP2: 1.450
TP3: 2.223
Extended targets: 2.801 – 4.215 if momentum strengthens.
📌 If confirmed, this would signal that 0.50–0.62 was the accumulation bottom before a major reversal.
---
🐻 Bearish Scenario
Confirmation Needed:
A daily close below 0.50 to validate the descending triangle breakdown.
Bearish Targets:
First support: 0.43
Next level: 0.36
📌 Failure to hold the 0.50–0.62 zone could trigger further downside continuation.
---
🎯 Trading Plan
Bullish Traders (Conservative): Wait for a close > 0.843 + retest → enter with staged targets.
Bullish Traders (Aggressive): Start accumulating inside 0.52–0.60 with a tight SL below 0.50.
Bearish Traders: Look for a strong rejection at 0.84 to short → target back to 0.50, or lower if breakdown occurs.
⚖️ Risk Management: This is a decision point. Use strict stop-loss management as this level can either trigger a major reversal or confirm bearish continuation.
---
📌 Notes
Volume is the key factor to separate a valid breakout from a bull trap.
This zone represents a make-or-break point for the medium-term trend.
---
IO/USDT (1D) — Price is consolidating in the 0.50–0.62 accumulation zone, a critical level that could decide the next big move.
Bullish if daily close > 0.843 → targets: 1.171 / 1.450 / 2.223.
Bearish if breakdown < 0.50 → targets: 0.43 / 0.36.
This is a major decision point. Watch for confirmation, beware of bull traps, and always use SL.
---
#IO #IOUSDT #CryptoAnalysis #Altcoin #TechnicalAnalysis #Breakout #SupportResistance #CryptoTrading #BullTrap
Timeframe: Daily (1D)
Main Trend: Prolonged downtrend since late 2024 (yellow trendline).
Key Zone: Price is consolidating inside the 0.50 – 0.62 accumulation box, which has acted as strong demand multiple times.
Breakout Attempt: Price briefly broke above the trendline and spiked to 0.84, but quickly rejected → potential bull trap.
---
🧩 Pattern Observations
1. Accumulation Zone (Yellow Box)
Multiple retests confirm this as a critical demand area.
Buyers and sellers are locked in a strong battle here.
2. Descending Triangle / Falling Wedge
Structure resembles a descending triangle (bearish bias if breakdown below 0.50).
Alternatively, it can be read as a falling wedge (bullish if breakout is confirmed).
3. False Breakout (Bull Trap?)
The spike to 0.84 followed by rejection hints at a possible liquidity grab.
Confirmation is needed to validate whether this is a reversal signal or just a trap.
---
🚀 Bullish Scenario
Confirmation Needed:
A daily close above 0.843 with strong volume.
Retest of the downtrend line as new support.
Bullish Targets:
TP1: 1.171
TP2: 1.450
TP3: 2.223
Extended targets: 2.801 – 4.215 if momentum strengthens.
📌 If confirmed, this would signal that 0.50–0.62 was the accumulation bottom before a major reversal.
---
🐻 Bearish Scenario
Confirmation Needed:
A daily close below 0.50 to validate the descending triangle breakdown.
Bearish Targets:
First support: 0.43
Next level: 0.36
📌 Failure to hold the 0.50–0.62 zone could trigger further downside continuation.
---
🎯 Trading Plan
Bullish Traders (Conservative): Wait for a close > 0.843 + retest → enter with staged targets.
Bullish Traders (Aggressive): Start accumulating inside 0.52–0.60 with a tight SL below 0.50.
Bearish Traders: Look for a strong rejection at 0.84 to short → target back to 0.50, or lower if breakdown occurs.
⚖️ Risk Management: This is a decision point. Use strict stop-loss management as this level can either trigger a major reversal or confirm bearish continuation.
---
📌 Notes
Volume is the key factor to separate a valid breakout from a bull trap.
This zone represents a make-or-break point for the medium-term trend.
---
IO/USDT (1D) — Price is consolidating in the 0.50–0.62 accumulation zone, a critical level that could decide the next big move.
Bullish if daily close > 0.843 → targets: 1.171 / 1.450 / 2.223.
Bearish if breakdown < 0.50 → targets: 0.43 / 0.36.
This is a major decision point. Watch for confirmation, beware of bull traps, and always use SL.
---
#IO #IOUSDT #CryptoAnalysis #Altcoin #TechnicalAnalysis #Breakout #SupportResistance #CryptoTrading #BullTrap
✅ Get Free Signals! Join Our Telegram Channel Here: t.me/TheCryptoNuclear
✅ Twitter: twitter.com/crypto_nuclear
✅ Join Bybit : partner.bybit.com/b/nuclearvip
✅ Benefits : Lifetime Trading Fee Discount -50%
✅ Twitter: twitter.com/crypto_nuclear
✅ Join Bybit : partner.bybit.com/b/nuclearvip
✅ Benefits : Lifetime Trading Fee Discount -50%
Exención de responsabilidad
La información y las publicaciones no constituyen, ni deben considerarse como asesoramiento o recomendaciones financieras, de inversión, de trading o de otro tipo proporcionadas o respaldadas por TradingView. Más información en Condiciones de uso.