HAL is looking bearish on higher time frame.

Monthly price action is bearish

Monthly MACD is NCO stat

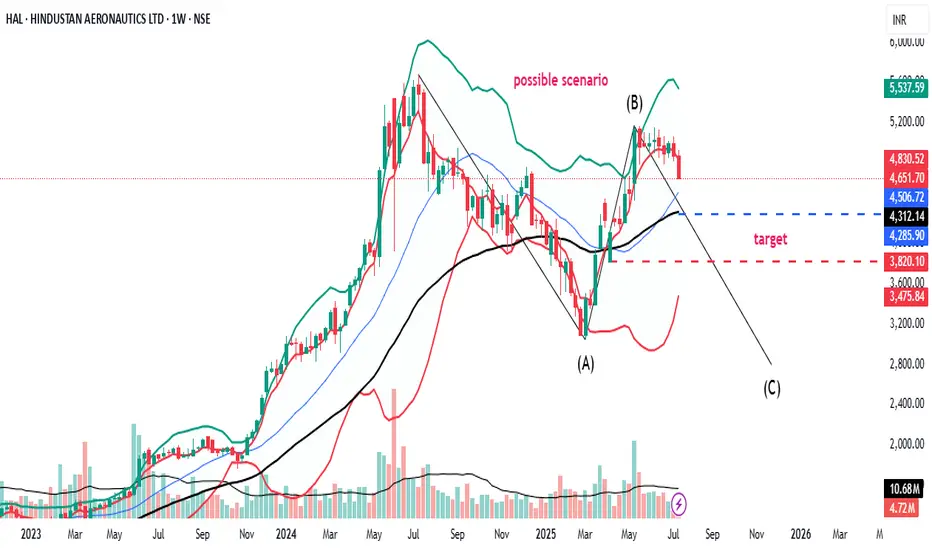
Weekly bearish price action. Price has broken last 8 weeks range. Looks like C wave is pending

Weekly MACD has given downtick

Weekly RSI is below 60

Daily price has challenged lowe bollinger band with good volume

Daily MACD is in NCO stat and below zero line

Daily RSI is below 40

Daily ADX is strong
Monthly price action is bearish
Monthly MACD is NCO stat
Weekly bearish price action. Price has broken last 8 weeks range. Looks like C wave is pending
Weekly MACD has given downtick
Weekly RSI is below 60
Daily price has challenged lowe bollinger band with good volume
Daily MACD is in NCO stat and below zero line
Daily RSI is below 40
Daily ADX is strong
Exención de responsabilidad
La información y las publicaciones no constituyen, ni deben considerarse como asesoramiento o recomendaciones financieras, de inversión, de trading o de otro tipo proporcionadas o respaldadas por TradingView. Más información en Condiciones de uso.
Exención de responsabilidad
La información y las publicaciones no constituyen, ni deben considerarse como asesoramiento o recomendaciones financieras, de inversión, de trading o de otro tipo proporcionadas o respaldadas por TradingView. Más información en Condiciones de uso.