📊 BANK NIFTY TRADING PLAN — 05 NOV 2025
(Timeframe Reference: 15-min Chart)
Chart Summary:
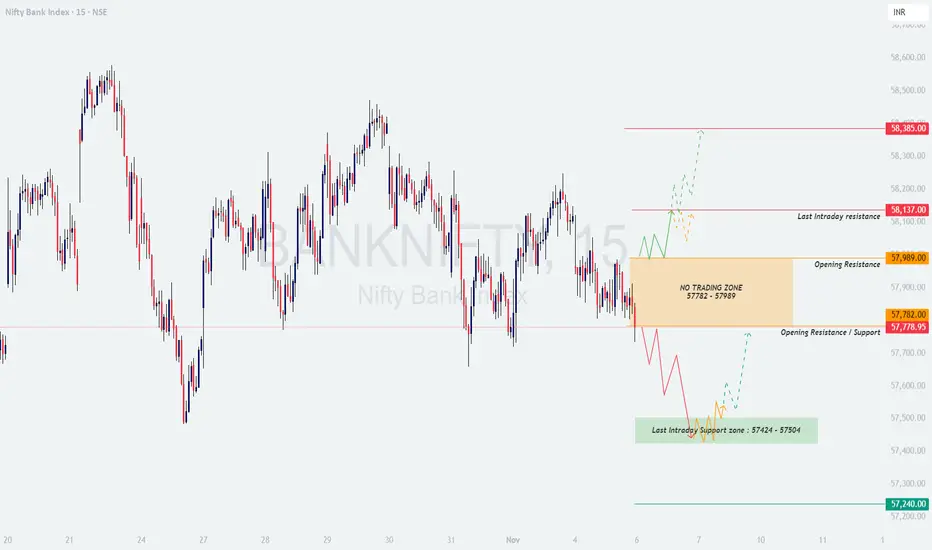
Bank Nifty is currently trading near the 57,780 zone, which lies just below the key Opening Resistance area (57,782 – 57,989). A clear No Trading Zone has been identified between these levels, suggesting indecision at the open. A strong directional move is expected once the index breaks out of this band.
🟢 Scenario 1: GAP-UP Opening (200+ points)
If Bank Nifty opens above 58,000, it will likely test the immediate resistance near 58,137. A sustained move above this could invite momentum buying towards 58,385 — the next intraday resistance.
🧠 Educational Note: Gap-up openings often trigger emotional entries. Always let the first 15–30 minutes settle before committing to a direction. Breakout confirmation through strong volume is essential to avoid traps.
🟧 Scenario 2: FLAT Opening (Within 57,782 – 57,989)
This range represents a No Trading Zone. Price is likely to remain volatile and whipsaw both sides before confirming direction. Patience is key here.
💡 Educational Tip: Flat openings are ideal for breakout traders. Wait for clear directional volume confirmation before entering. Most false moves happen when traders anticipate instead of reacting.
🔴 Scenario 3: GAP-DOWN Opening (200+ points)
If the index opens below 57,600, weakness may extend towards the Last Intraday Support zone (57,424 – 57,504). This zone is critical for bulls to defend.
📘 Educational Insight: Gap-downs often lead to panic selling in the first 10–15 minutes. Always wait for the price to form a base before anticipating reversals. Intraday traders should track if volume drops near key support levels — it often hints at exhaustion of selling.
💼 RISK MANAGEMENT TIPS FOR OPTIONS TRADERS:
📈 SUMMARY:
📚 CONCLUSION:
The structure suggests Bank Nifty is at a crucial decision point. Bulls must reclaim 58,000+ to re-establish control, while bears will try to push it below 57,780. Staying patient during the opening volatility and respecting breakout levels can make the difference between profit and emotional trades.
⚠️ DISCLAIMER:
I am not a SEBI-registered analyst. The views expressed here are for educational purposes only. Please conduct your own research or consult a financial advisor before making trading decisions.
(Timeframe Reference: 15-min Chart)
Chart Summary:
Bank Nifty is currently trading near the 57,780 zone, which lies just below the key Opening Resistance area (57,782 – 57,989). A clear No Trading Zone has been identified between these levels, suggesting indecision at the open. A strong directional move is expected once the index breaks out of this band.
🟢 Scenario 1: GAP-UP Opening (200+ points)
If Bank Nifty opens above 58,000, it will likely test the immediate resistance near 58,137. A sustained move above this could invite momentum buying towards 58,385 — the next intraday resistance.
- []If price sustains above 58,137 with strong candle close, traders may consider long positions with a target towards 58,385.
[]Stop-loss can be maintained just below 57,980, as falling below this zone may trigger a pullback back into the range. - If price fails to sustain above 58,137 and shows rejection candles, short traders can look for a retracement back toward 57,989 – 57,780 zone.
🧠 Educational Note: Gap-up openings often trigger emotional entries. Always let the first 15–30 minutes settle before committing to a direction. Breakout confirmation through strong volume is essential to avoid traps.
🟧 Scenario 2: FLAT Opening (Within 57,782 – 57,989)
This range represents a No Trading Zone. Price is likely to remain volatile and whipsaw both sides before confirming direction. Patience is key here.
- []Avoid initiating fresh positions within the zone (57,782 – 57,989).
[]If price breaks above 57,989 decisively, expect a potential rise toward 58,137, followed by 58,385. - If price breaks below 57,782, it may drag the index towards the lower intraday support near 57,504 – 57,424.
💡 Educational Tip: Flat openings are ideal for breakout traders. Wait for clear directional volume confirmation before entering. Most false moves happen when traders anticipate instead of reacting.
🔴 Scenario 3: GAP-DOWN Opening (200+ points)
If the index opens below 57,600, weakness may extend towards the Last Intraday Support zone (57,424 – 57,504). This zone is critical for bulls to defend.
- []If a reversal candle forms near 57,424 – 57,504, buyers may attempt a short-covering move back toward 57,780.
[]However, a sustained move below 57,400 can extend the fall toward 57,240, which acts as the final intraday support. - Traders should avoid shorting deep gap-downs immediately — instead, wait for a pullback to the nearest resistance (57,700–57,780) for better risk-reward.
📘 Educational Insight: Gap-downs often lead to panic selling in the first 10–15 minutes. Always wait for the price to form a base before anticipating reversals. Intraday traders should track if volume drops near key support levels — it often hints at exhaustion of selling.
💼 RISK MANAGEMENT TIPS FOR OPTIONS TRADERS:
- []Avoid buying options during the first 15 minutes of volatile openings — IV (Implied Volatility) spikes can inflate premium costs.
[]Always define your risk before entering. Limit your exposure to 1–2% of total capital per trade.
[]If trading intraday options, trail your stop-loss after a 30–40 point favorable move in Bank Nifty.
[]Use ITM options for directional confidence and avoid far OTM strikes on non-trending days. - Stay disciplined — remember, missing a trade is better than being trapped in a false breakout.
📈 SUMMARY:
- []🟧 No Trading Zone: 57,782 – 57,989
[]🟥 Resistance Zones: 58,137 / 58,385
[]🟩 Support Zones: 57,504 – 57,424 / 57,240
[]⚖️ Bias: Neutral-to-Bullish above 57,989 | Weakness below 57,782
📚 CONCLUSION:
The structure suggests Bank Nifty is at a crucial decision point. Bulls must reclaim 58,000+ to re-establish control, while bears will try to push it below 57,780. Staying patient during the opening volatility and respecting breakout levels can make the difference between profit and emotional trades.
⚠️ DISCLAIMER:
I am not a SEBI-registered analyst. The views expressed here are for educational purposes only. Please conduct your own research or consult a financial advisor before making trading decisions.
Exención de responsabilidad
La información y las publicaciones no constituyen, ni deben considerarse como asesoramiento o recomendaciones financieras, de inversión, de trading o de otro tipo proporcionadas o respaldadas por TradingView. Más información en Condiciones de uso.
Exención de responsabilidad
La información y las publicaciones no constituyen, ni deben considerarse como asesoramiento o recomendaciones financieras, de inversión, de trading o de otro tipo proporcionadas o respaldadas por TradingView. Más información en Condiciones de uso.